Abstract
Fluorescence fluctuation-based superresolution techniques can achieve fast superresolution imaging on a cost-effective wide-field platform at a low light level with reduced phototoxicity. However, the current methods exhibit certain imaging deficiencies that misinterpret nanoscale features reconstructed from fluctuating image sequences, thus degrading the superresolution imaging quality and performance. Here we propose cross-cumulant enhanced radiality nanoscopy (CERN), which employs cross-cumulant analysis in tandem with radiality processing. We demonstrated that CERN can significantly improve the spatial resolution at a low light level while eliminating the misinterpretations of nanoscale features of the existing fluctuation-based superresolution methods. In the experiment, we further verified the superior performance of CERN over the current methods through performing multicolor superresolution imaging of subcellular microtubule networks and clathrin-coated pits as well as the high-precision reconstruction of densely packed RNA transcripts.1. INTRODUCTION
Optical super-resolution nanoscopy has brought the investigation of living subcellular structures down to the nanoscale regime [1–3]. Of the many superresolution techniques, single-molecule localization microscopy (SMLM) has achieved a spatial resolution of tens of nanometers with relatively compromised temporal resolution [4–6]. Stimulated emission depletion (STED) microscopy can realize fast superresolution imaging accompanied by potentially higher phototoxicity induced by high-power density illumination [7–9]. Furthermore, structured illumination microscopy (SIM) has the capability of implementing high-speed superresolution reconstruction with a twofold resolution improvement with respect to the diffraction limit [10,11]. Moreover, spontaneous fluorescence fluctuation-based techniques can achieve a satisfactory trade-off among imaging speed, spatial resolution, system cost, and phototoxicity [12–19]. For instance, superresolution optical fluctuation imaging (SOFI) has generally achieved superresolution imaging based on a conventional wide-field microscope with a low light illumination level [20–27]. Superresolution radial fluctuation imaging (SRRF) realizes the superresolution reconstruction with fewer frame numbers for real-time imaging [28,29]. For data sets similar to those collected in photoactivated localization microscopy/stochastic optical reconstruction microscopy (PALM/STORM) imaging, SRRF can achieve resolutions approaching those of standard single-molecule localization analysis. However, for the situations with high on-time radio fluctuations, higher spatiotemporal resolution improvement is strongly demanded when further investigating subcellular details. In this study, we propose cross-cumulant enhanced radiality nanoscopy (CERN) by integrating the cross-cumulant analysis in SOFI and radiality processing in SRRF, aiming to further improve the spatiotemporal resolution of fluctuation-based superresolution techniques. The proposed method can significantly improve the superresolution quality and performance even in low signal-to-noise ratio (SNR) conditions. In the experiment, combined with the expansion microscopy (ExM) technique [30], our method is capable of achieving approximately 10 nm line profiling of subcellular structures and effectively separating adjacent nanoscale structures. We experimentally achieved multicolor superresolution of subcellular microtubules and clathrin-coated pits (CCPs). In addition, we investigated the densely packed distribution of RNA transcripts in the nucleus of an HeLa cell, revealing the delicate spatial organization of RNA molecules.
2. PRINCIPLES AND METHODS
CERN integrates the advantages of the cross-cumulant analysis from SOFI and the radiality processing from SRRF. To reconstruct a CERN superresolution image, we first employed spatiotemporal cross-cumulant processing on the collected image sequence. As the wide-field optical system generally has a Gaussian point spread function (PSF), the th order spatiotemporal cross-cumulant processing can be generally formulated as [13,20] In Eq. (1), denotes the spatial position of the physical pixel on the image detector. is the cumulant order. and are the th fluorophore and the total number of fluorophores. is the fluorophore’s brightness. PSF represents the point spread function of the acquisition system. describes the fluorescence fluctuation sequence of fluorophores. calculates the th order cumulant function of the fluctuation sequence. In this study, we employed the second-order cumulant analysis for the first step of CERN imaging. As we performed cross-cumulant analysis from different pixels , then the generated cumulant image is able to eliminate the interpixel uncorrelated shot noise. Thus, the second-order cross-cumulant image can be interpreted as In Eq. (2), the generated interpixel cross-cumulant values were calculated from the different adjacent values of the real pixels in the collected image sequence. is a correction factor for correcting the different intensities due to the different distances from the adjacent pixels. denotes the fluctuations of the image sequence, and is the temporal time lag of the image sequence. Therefore, by calculating the spatiotemporal cross-cumulant values described in Eq. (2) pixel by pixel on the image, the cross-cumulant image can be obtained. The employment of cross-cumulant analysis can effectively eliminate the shot noise of the images, while enhancing the differentiation of the overlapping areas from nonoverlapping regions of fluorophores by analyzing the different correlation levels of the pixelated fluctuating signals. Then, as stated in the theory of balanced SOFI (bSOFI), the deconvolution and the square root calculations are subsequently applied to the cumulant image for linearizing the brightness response of the reconstructed image [20]. The amplified noise can be reduced by truncating small values and a twofold resolution enhancement can be obtained by reconvolving the image with [20]. Based on the above-mentioned second-order cross-cumulant image , we subsequently implemented radiality processing through the SRRF algorithm. The radiality processing can achieve further resolution enhancement and assist in the accurate separation of the overlapping subcellular structures. By defining a magnified grid () for higher resolution image presentation, we then calculate the intensity gradient distributions on the second-order cross-cumulant image . The gradient line equation can be formulated as [15] Then, the minimum perpendicular distance from the defined point () to the gradient line direction can be calculated mathematically. Subsequently, the radiality calculation can be defined as the mean convergence for ring coordinates ( is 12 by default) equally distributed around a ring of radius in the pixel (, ) [15], In Eq. (4), the radiality map is obtained from the intensity distribution of the second-order cross-cumulant image . The radiality processing can further extract the nanoscale frameworks from the cross-cumulant image, hence further improving the spatial resolution of the reconstructed images. Therefore, we obtained the CERN image through the cross-cumulant analysis and the subsequent radiality mapping.
3. RESULTS AND DISCUSSION
A. Simulation of CERN Superresolution Imaging
First, we simulated a 2D array of ring-like structures with varying radii from 65 to 125 nm, shown in Fig. 1(a). Then, a stack of images is generated with significant fluctuating intensities that mimic the spontaneous fluorescence fluctuation (fluorescence intermittency) of conventional fluorophores (e.g., quantum dots, organic dyes, and part of fluorescent proteins). Meanwhile, Poisson noise (shot noise) is added to each frame of the generated image sequence. In the simulation, different levels of Poisson noise are added in a discrete manner along the vertical direction from top to bottom of the generated images, resulting in different SNR distribution. The SNR distribution is presented in Fig. 1(c). To suppress the noise influence and achieve high-quality superresolution reconstruction, we first implemented the second-order cumulant analysis to the generated wide-field image sequence. As shown in Fig. 1(d), compared to the wide-field image presented in Fig. 1(b), we obtained a resolution-enhanced image with noise suppression. Nonetheless, the ring-like structures with smaller radii cannot be clearly unveiled. One pathway to further enhance the resolution is to introduce higher-order cumulant analysis; however, our test for higher-order cross-cumulant processing induced severe artifact signals. Instead, we implemented the SRRF method to achieve further resolution enhancement. As shown in Figs. 1(e)–1(g), we employed SRRF reconstructions with different calculation modes, i.e., temporal radiality average (TRA), temporal radiality maximum (TRM), and temporal radiality pairwise product mean (TRPPM). The presented images are able to accurately resolve the ring-like structures with relatively larger radii. Yet, for smaller ring-like structures with either high or low noise background, shown in the right region in Figs. 1(e)–1(g), the SRRF reconstructions with TRA, TRM, and TRPPM modes are unable to correctly uncover the ring-like structures. In addition, we tested the performance of SRRF reconstruction with temporal radiality autocumulant (TRAC 2, 3, and 4) calculations, shown in Figs. 1(h)–1(j). The results also exhibited the misinterpretation of small ring-like structures. In order to tackle this problem and with the aim of achieving high-quality superresolution imaging of nanoscale details, we thus introduce the CERN method. To improve the continuity of the reconstructed image, we performed the superresolution imaging of the ring-like structures by combining three reconstructed images from three sets of sequentially collected 100-frame image sequences. As can be seen in Fig. 1(k), we obtained a CERN image with significantly higher resolution and performance in comparison with the wide-field, SOFI, and SRRF with various calculation modes.
Sign up for Photonics Research TOC. Get the latest issue of Photonics Research delivered right to you!Sign up now
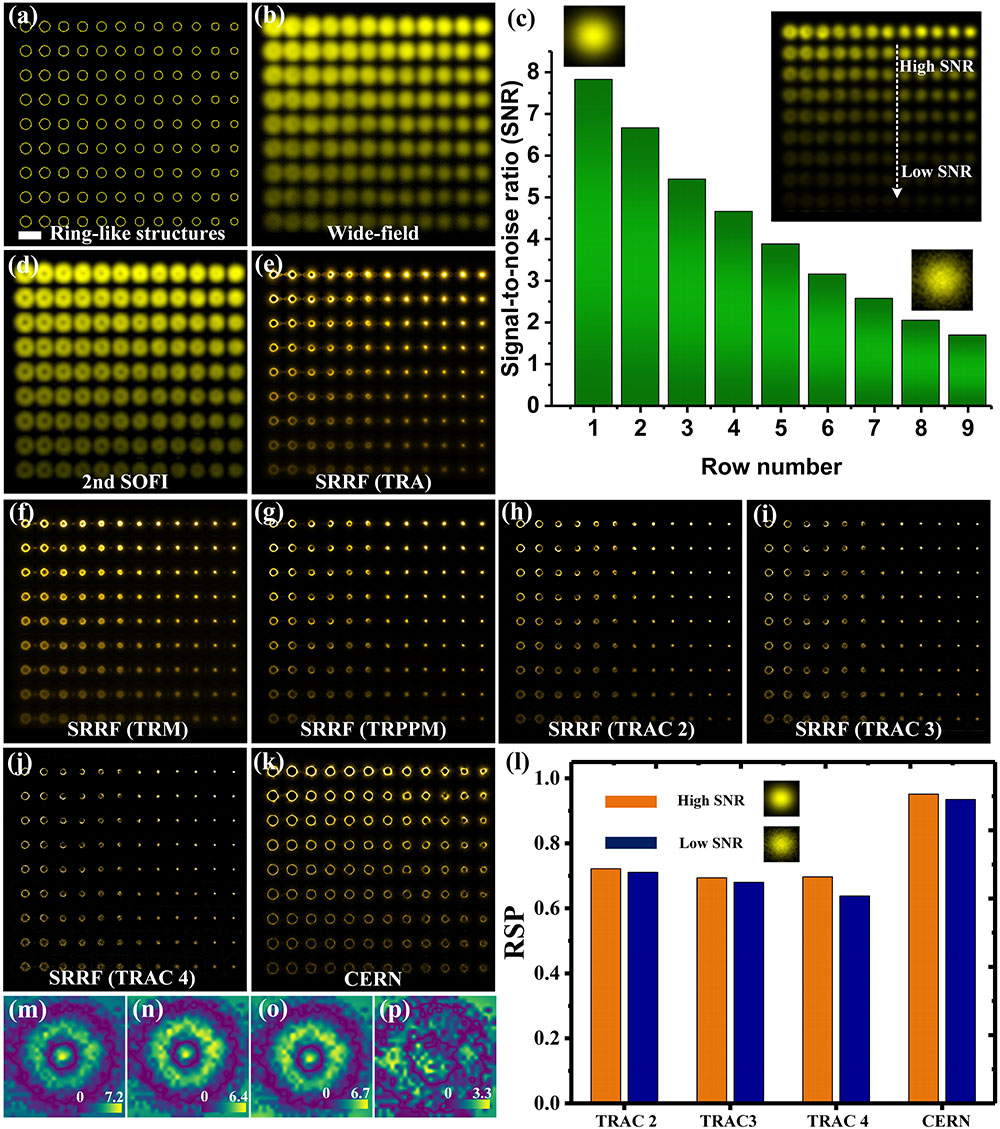
Figure 1.(a) Simulated 2D array of ring-like structures with varying radii; (b) wide-field imaging of the simulated ring-like structures; (c) distribution of different SNRs by adding different levels of Poisson noise in a discrete manner along the vertical direction; (d) second-order SOFI of the simulated ring-like structures; (e)–(g) SRRF of the simulated ring-like structures with TRA, TRM, and TRPPM calculation modes; (h)–(j) SRRF of the simulated ring-like structures with TRAC 2, TRAC 3, and TRAC 4 calculation modes; (k) CERN imaging of the simulated ring-like structures; (l) RSP coefficient evaluation of the reconstructed ring-like structures by different imaging methods in the high SNR and low SNR regions; (m)–(p) RSE evaluation of the reconstructed ring-like structures in the low SNR region with TRAC 2, TRAC 3, TRAC 4, and CERN imaging methods. The histograms of (b) and (d) were equalized for clear visualization of the low SNR structures. The source code and data set are available on Github, https://github.com/zhipingzeng/CERN. Scale bar, 500 nm.
Subsequently, as TRAC 2, TRAC 3, TRAC 4, and CERN all employed cumulants for further enhancing the spatial resolution, we implemented the resolution-scaled Pearson (RSP) coefficient and resolution-scaled error (RSE) evaluations in NanoJ-SQUIRREL for the further comparison of their superresolution imaging performances [31]. The RSE and RSP evaluations calculate the similarity errors and correlation coefficient between the resolution-scaled image and the reference diffraction-limited image. The definition of RSE can be formulated as [31] In Eq. (5), and represent the diffraction-limited image and the resolution-scaled image. is the total pixel number of the images. The definition of RSP can be expressed as [31] In Eq. (6), and are the average values of and , respectively.
As presented in Fig. 1(l), both in the high SNR and low SNR regions, the CERN imaging exhibited superior performance in terms of RSP metric over the other SRRF calculation modes. In Figs. 1(m)–1(p), we calculated the RSE maps of the TRAC 2, TRAC 3, TRAC 4, and CERN reconstructions in the low SNR region for the small ring-like structure. For different orders of TRAC reconstructions, the error maps present significant discrepancies between the convolved reconstructed superresolution images and the reference diffraction-limited structures, indicating the degraded performance by the TRAC 2, TRAC 3, and TRAC 4 reconstructions. The error map of the CERN superresolution reconstruction exhibits less discrepancy with the reference structures, demonstrating the superior performance of the CERN approach on the nanoscale structure reconstruction. Consequently, the employment of the cross-cumulant analysis in conjunction with radiality processing (CERN) is capable of significantly enhancing the spatiotemporal superresolution imaging performance under the conventional wide-field acquisition, thereby providing biologists with an easy-to-use and widely accessible superresolution approach.
To demonstrate the capability of reconstructing high-quality superresolution images by employing CERN for dynamic nanoscale structures, we simulated a tubulin-like network with dynamic doughnut-shaped and point-like nanoscale cargoes moving along network lines. For imaging dynamic structures, we used fewer frames for SRRF and CERN imaging. Reducing the frame number requires fast intensity fluctuations for the labeled fluorophores. Therefore, in this simulation, we increased the intensity fluctuations for the generated image sequences. The development of the blinking enhanced quantum (BEQ) dot has demonstrated fluorescence fluctuation-based imaging with fewer frames [32]. As shown in Fig. 2, the tubulin-like network and six cargoes emit fluctuating signals that can be recorded as an image sequence containing 25 frames. The cargoes moving to the left and right directions along network lines are indicated by red and blue arrows, respectively. Figure 2(a) shows the wide-field averaging image that cannot distinguish the detailed features of the moving cargoes. As can be seen in Figs. 2(b) and 2(c), the SOFI and SRRF images can both enhance the spatial resolution of the dynamic structures. However, the two reconstructions fail to accurately differentiate the doughnut-shaped cargoes from the point-like counterparts. The SRRF reconstruction is inclined to erroneously recognize doughnut-shaped cargoes as point-like ones. For the CERN reconstruction, shown in Fig. 2(d), the spatial resolution can be drastically improved. Moreover, the CERN method is able to accurately discern the two different types of cargoes. According to the reconstructed result in Fig. 2(d), the point-like cargoes are marked by “P” and the doughnut-shaped cargoes are marked by “D,” respectively. This result is in accordance with the original structures. The corresponding magnified images are presented in Figs. 2(e)–2(h), which clearly demonstrate the superior dynamic imaging performance of the CERN reconstruction.

Figure 2.(a) Wide-field image of the simulated tubulin-like network with dynamic doughnut-shaped and point-like nanoscale cargoes moving along network lines; (b), (c) second-order SOFI and SRRF (TRA) images of the simulated dynamic structure; (d) CERN image of the simulated dynamic structure, precisely discerning the doughnut-shaped cargoes (marked by “D”) from the point-like cargoes (marked by “P”); (e)–(h) magnified images indicated by the white dotted regions from (a) to (d). For the cargoes marked by “P,” we generated the cargo images by convolving point-like structures (30 nm radii) with a Gaussian PSF. For the cargoes marked by “D,” we generated the cargo images by convolving ring-like structures (90 nm radii) with a smaller Gaussian PSF. Different PSFs indicated the labeling of two different types of fluorophores with distinct wavelengths for imaging different targets. The blue and red arrows represent the different moving directions of the cargoes along the network lines. Scale bars, 1 μm in (a)–(d); 300 nm in (e)–(h).
B. Multicolor CERN Imaging of Microtubule Networks and CCPs
In the experiment, we verified the application of CERN for multicolor superresolution imaging of subcellular microtubules and CCPs. Qdot655 and Qdot705 were utilized to label microtubules and CCPs, respectively. A 488 nm laser was employed to excite the two types of Qdots for fluorescence emission, and the image sequence was sequentially recorded through wide-field acquisition. To achieve ultrahigh spatial resolution, we first employed the ExM method for sample preparation [30,33]. The physical sizes of the subcellular structures can be expanded fourfold with respect to the original sizes. Subsequently, the image sequences were acquired by the wide-field detection. As shown in Figs. 3(a) and 3(f), the wide-field images cannot clearly discern the detailed structures of the CCPs. For the second-order SOFI and SRRF images shown in Figs. 3(b) and 3(c), the hollow structures of CCPs can be revealed. Moreover, higher resolution can be obtained by CERN imaging. In Figs. 3(d) and 3(i), the hollow structures of the CCPs can be clearly revealed by the CERN reconstruction. In addition, in Fig. 3(e), the estimated full width at half-maximum (FWHM) of the reconstructed subcellular structure was approximately 10 nm by using 300 image frames for CERN reconstruction. Moreover, we calculated the RSE maps for further evaluation of the superresolution performance by SRRF with TRAC 2 mode and CERN reconstructions. As shown in Figs. 3(j) and 3(k), the RSE maps showcase less image discrepancy of CERN image in contrast with that of the TRAC 2 image. In addition, we further demonstrated the resolution improvement by plotting the line profiles of the second SOFI-, SRRF (TRAC 2)-, and CERN-reconstructed closely separated filaments, as shown in Fig. 3(l). As can be seen, CERN is able to resolve the separated filaments, whereas the second SOFI and SRRF cannot resolve the delicate nanoscale structures. Hence, we demonstrated that for data sets with a high on-time fluorophore ratio for improved temporal resolution, the CERN approach outperforms SOFI and SRRF in superresolution reconstructions. In this regard, CERN would be an option for fast high-quality superresolution imaging with low-light level illumination and cost-effective configuration.
Figure 3.(a), (b) Multicolor wide-field and second-order SOFI images of the subcellular microtubule network and CCPs [33]; (c) SRRF image with TRAC 2 calculation mode of the microtubule network and CCPs; (d) CERN image of the microtubule network and CCPs; (e) line profiles of the wide-field, second SOFI-, SRRF (TRAC 2)-, and CERN-reconstructed CCPs indicated by the white arrows in (f)–(i); (f)–(i) magnified images of the white dotted regions from (a)–(d); (j)–(k) RSE evaluation of the reconstructed CCP in TRAC 2 and CERN imaging; (l) line profiles of the second SOFI-, SRRF (TRAC 2)-, and CERN-reconstructed closely separated filaments located by the red arrows in (b)–(d). Scale bars, 1 μm in (a)–(d); 500 nm in (f)–(i).
C. CERN Imaging of Densely Packed RNA Transcripts
In another experiment, we applied CERN for RNA transcript imaging. The RNA molecules were fluorescently labeled with the dye Alexa 532 [34]. The fluctuating image sequence was recorded under a conventional wide-field microscope configuration. In Fig. 4(a), the wide-field image exhibits blurry structures with low spatial resolution. The second-order SOFI can suppress the image noise and enhance the spatial resolution, but the resolution improvement is limited. The SRRF with TRPPM and TRAC 2 calculation modes as well as ThunderSTORM images shown in Figs. 4(c)–4(e) can achieve moderate resolution enhancement in that part of the densely packed distribution of RNA molecules that can be spatially revealed. For the CERN imaging in Fig. 4(f), the spatial organization of RNA molecules can be further discerned with higher resolving power. For a detailed comparison, we evaluated the line profiles of the reconstructed RNA molecules from the aforementioned superresolution approaches. As can be seen in Fig. 4(g), the CERN imaging presents superior performance on the differentiation of close-by RNA molecules within the optical diffraction spot. As a quantitative evaluation of the resolution improvement, we calculated the Fourier ring correlation (FRC) implemented by the NanoJ-SQUIRREL package [31]. The minimum FRC values of the reconstructed images from different methods are shown in Fig. 4(h). As can be seen, by adopting the FRC evaluation as a metric, the CERN method can achieve a minimum FRC value of , whereas, the FRC values for SRRF and ThunderSTORM imaging are 40–60 nm. Consequently, the CERN imaging has the capability of discerning nanoscale clustering particles, which would be a useful approach for high-density particle tracking applications.
Figure 4.(a) Wide-field image of the densely pack RNA transcripts; (b)–(d) second-order SOFI, SRRF (TRPPM), and SRRF (TRAC 2) images of the RNA molecule distribution; (e) ThunderSTORM image of the RNA molecule distribution [34]; (f) CERN image of the RNA molecules; (g) line profiles of the SRRF (TRPPM)-, SRRF (TRAC 2)-, ThunderSTORM-, and CERN-reconstructed RNA molecules indicated by the white arrows in (c)–(f). (h) FRC comparison of the reconstructed superresolution images from SRRF (TRPPM), SRRF (TRAC 2), ThunderSTORM, and CERN methods. The standard deviations were calculated by using three different image sequences for image reconstructions. Raw data courtesy of the GigaScience Database [34]. Scale bars, 1 μm in (a)–(f).
4. CONCLUSION
In this study, we evaluated the existing imaging deficiencies of SOFI and SRRF superresolution reconstructions by simulation. To cope with the current image reconstruction problems, we proposed the CERN method, which is capable of compensating for the limited resolution improvement of the conventional SOFI and the image misinterpretation of SRRF in reconstructing nanoscale ultrastructures. For the simulation results, our approach successfully differentiated the ring-like structures with a variety of nanoscale sizes in different SNR conditions. In the dynamic simulation, we evaluated the performances of different fluctuation-based superresolution methods on imaging dynamic targets. We demonstrated that the CERN approach can achieve fast high-quality superresolution imaging by accurately discerning dynamic doughnut-shaped cargoes from point-like counterparts in subdiffraction sizes. In the experiment, by further integrating ExM with the proposed method, we realized multicolor superresolution of subcellular microtubule networks and CCPs with an estimated FWHM line profiling of approximately 10 nm based on a conventional wide-field microscope. Furthermore, in the experiment that investigated the densely packed RNA molecule distribution, CERN is able to effectively separate highly clustered nanoscale structures. We assessed the FRC values of the reconstructed images from different fluctuation-based superresolution methods. The CERN approach presented the minimum FRC value among all the evaluated methods, meaning that CERN can better identify the nanoscale molecules in highly clustered distributions. Therefore, CERN can significantly improve the spatial resolution at low-light levels while eliminating the misinterpretations of nanoscale features of fluctuation-based superresolution methods. In conclusion, CERN would be widely applicable to various imaging applications encompassing live-cell subcellular imaging and high-density tracking.
Acknowledgment
Acknowledgment. We thank Dr. Rongqin Li for providing part of the experimental data sets.
References
[1] Y. M. Sigal, R. Zhou, X. Zhuang. Visualizing and discovering cellular structures with super-resolution microscopy. Science, 361, 880-887(2018).
[2] S. J. Sahl, S. W. Hell, S. Jakobs. Fluorescence nanoscopy in cell biology. Nat. Rev. Mol. Cell Biol., 18, 685-701(2017).
[3] Z. Zeng, P. Xi. Advances in three-dimensional super-resolution nanoscopy. Microsc. Res. Tech., 79, 893-898(2016).
[4] E. Betzig, G. H. Patterson, R. Sougrat, O. W. Lindwasser, S. Olenych, J. S. Bonifacino, M. W. Davidson, J. Lippincott-Schwartz, H. F. Hess. Imaging intracellular fluorescent proteins at nanometer resolution. Science, 313, 1642-1645(2006).
[5] M. J. Rust, M. Bates, X. Zhuang. Sub-diffraction-limit imaging by stochastic optical reconstruction microscopy (STORM). Nat. Meth., 3, 793-796(2006).
[6] S. T. Hess, T. P. Girirajan, M. D. Mason. Ultra-high resolution imaging by fluorescence photoactivation localization microscopy. Biophys. J., 91, 4258-4272(2006).
[7] J. Chojnacki, T. Staudt, B. Glass, P. Bingen, J. Engelhardt, M. Anders, J. Schneider, B. Müller, S. W. Hell, H.-G. Kräusslich. Maturation-dependent HIV-1 surface protein redistribution revealed by fluorescence nanoscopy. Science, 338, 524-528(2012).
[8] S. W. Hell, J. Wichmann. Breaking the diffraction resolution limit by stimulated emission: stimulated-emission-depletion fluorescence microscopy. Opt. Lett., 19, 780-782(1994).
[9] W. Yan, Y. Yang, Y. Tan, X. Chen, Y. Li, J. Qu, T. Ye. Coherent optical adaptive technique improves the spatial resolution of STED microscopy in thick samples. Photon. Res., 5, 176-181(2017).
[10] M. G. Gustafsson. Surpassing the lateral resolution limit by a factor of two using structured illumination microscopy. J. Microsc., 198, 82-87(2000).
[11] X. Huang, J. Fan, L. Li, H. Liu, R. Wu, Y. Wu, L. Wei, H. Mao, A. Lal, P. Xi, L. Tang, Y. Zhang, Y. Liu, S. Tan, L. Chen. Fast, long-term, super-resolution imaging with Hessian structured illumination microscopy. Nat. Biotechnol., 36, 451-459(2018).
[12] A. L. Efros, D. J. Nesbitt. Origin and control of blinking in quantum dots. Nat. Nanotechnol., 11, 661-671(2016).
[13] T. Dertinger, R. Colyer, G. Iyer, S. Weiss, J. Enderlein. Fast, background-free, 3D super-resolution optical fluctuation imaging (SOFI). Proc. Natl. Acad. Sci. USA, 106, 22287-22292(2009).
[14] I. Yahiatene, S. Hennig, M. Müller, T. Huser. Entropy-based super-resolution imaging (ESI): from disorder to fine detail. ACS Photon., 2, 1049-1056(2015).
[15] N. Gustafsson, S. Culley, G. Ashdown, D. M. Owen, P. M. Pereira, R. Henriques. Fast live-cell conventional fluorophore nanoscopy with ImageJ through super-resolution radial fluctuations. Nat. Commun., 7, 12471(2016).
[16] S. Cox, E. Rosten, J. Monypenny, T. Jovanovic-Talisman, D. T. Burnette, J. Lippincott-Schwartz, G. E. Jones, R. Heintzmann. Bayesian localization microscopy reveals nanoscale podosome dynamics. Nat. Meth., 9, 195-200(2012).
[17] D. T. Burnette, P. Sengupta, Y. Dai, J. Lippincott-Schwartz, B. Kachar. Bleaching/blinking assisted localization microscopy for superresolution imaging using standard fluorescent molecules. Proc. Natl. Acad. Sci. USA, 108, 21081-21086(2011).
[18] X. Chen, Z. Liu, R. Li, C. Shan, Z. Zeng, B. Xue, W. Yuan, C. Mo, P. Xi, C. Wu. Multicolor super-resolution fluorescence microscopy with blue and carmine small photoblinking polymer dots. ACS Nano, 11, 8084-8091(2017).
[19] X. Chen, Z. Zeng, H. Wang, P. Xi. Three-dimensional multimodal sub-diffraction imaging with spinning-disk confocal microscopy using blinking/fluctuating probes. Nano Res., 8, 2251-2260(2015).
[20] S. Geissbuehler, N. L. Bocchio, C. Dellagiacoma, C. Berclaz, M. Leutenegger, T. Lasser. Mapping molecular statistics with balanced super-resolution optical fluctuation imaging (bSOFI). Opt. Nanosc., 1, 4-7(2012).
[21] T. Dertinger, R. Colyer, R. Vogel, J. Enderlein, S. Weiss. Achieving increased resolution and more pixels with Superresolution Optical Fluctuation Imaging (SOFI). Opt. Express, 18, 18875-18885(2010).
[22] Z. Zeng, X. Chen, H. Wang, N. Huang, C. Shan, H. Zhang, J. Teng, P. Xi. Fast super-resolution imaging with ultra-high labeling density achieved by joint tagging super-resolution optical fluctuation imaging. Sci. Rep., 5, 8359(2015).
[23] T. Dertinger, A. Pallaoro, G. Braun, S. Ly, T. A. Laurence, S. Weiss. Advances in superresolution optical fluctuation imaging (SOFI). Quart. Rev. Biophys., 46, 210-221(2013).
[24] S. Geissbuehler, A. Sharipov, A. Godinat, N. L. Bocchio, P. A. Sandoz, A. Huss, N. A. Jensen, S. Jakobs, J. Enderlein, F. G. Van Der Goot. Live-cell multiplane three-dimensional super-resolution optical fluctuation imaging. Nat. Commun., 5, 5830(2014).
[25] S. Jiang, Y. Zhang, H. Yang, Y. Xiao, X. Miao, R. Li, Y. Xu, X. Zhang. Enhanced SOFI algorithm achieved with modified optical fluctuating signal extraction. Opt. Express, 24, 3037-3045(2016).
[26] W. Xuehua, C. Danni, Y. Bin, N. Hanben. Statistical precision in super-resolution optical fluctuation imaging. Appl. Opt., 55, 7911-7916(2016).
[27] L. Zou, S. Zhang, B. Wang, J. Tan. High-order super-resolution optical fluctuation imaging based on low-pass denoising. Opt. Lett., 43, 707-710(2018).
[28] S. Culley, K. L. Tosheva, P. M. Pereira, R. Henriques. SRRF: universal live-cell super-resolution microscopy. Int. J. Biochem. Cell Biol., 101, 74-79(2018).
[29] Z. Zeng, J. Ma, P. Xi, C. Xu. Joint tagging assisted fluctuation nanoscopy enables fast high-density super-resolution imaging. J. Biophoton., 11, e201800020(2018).
[30] F. Chen, P. W. Tillberg, E. S. Boyden. Expansion microscopy. Science, 347, 543-548(2015).
[31] S. Culley, D. Albrecht, C. Jacobs, P. M. Pereira, C. Leterrier, J. Mercer, R. Henriques. Quantitative mapping and minimization of super-resolution optical imaging artifacts. Nat. Meth., 15, 263-266(2018).
[32] T. M. Watanabe, S. Fukui, T. Jin, F. Fujii, T. Yanagida. Real-time nanoscopy by using blinking enhanced quantum dots. Biophys. J., 99, L50-L52(2010).
[33] R. Li, X. Chen, Z. Lin, Y. Wang, Y. Sun. Expansion enhanced nanoscopy. Nanoscale, 10, 17552-17556(2018).
[34] T. Lukes, J. Pospisil, K. Fliegel, T. Lasser, G. M. Hagen. Quantitative super-resolution single molecule microscopy dataset of YFP-tagged growth factor receptors. GigaScience, 7, giy002(2018).

