
Zhou Dengwang, Wang Benzhang, Ba Dexin, Xu Jinlong, Xu Pengbai, Jiang Taofei, Zhang Dongyu, Li Hui, Dong Yongkang. Fast Distributed Brillouin Optical Fiber Sensing for Dynamic Strain Measurement[J]. Acta Optica Sinica, 2018, 38(3): 328005
- Acta Optica Sinica
- Vol. 38, Issue 3, 328005 (2018)
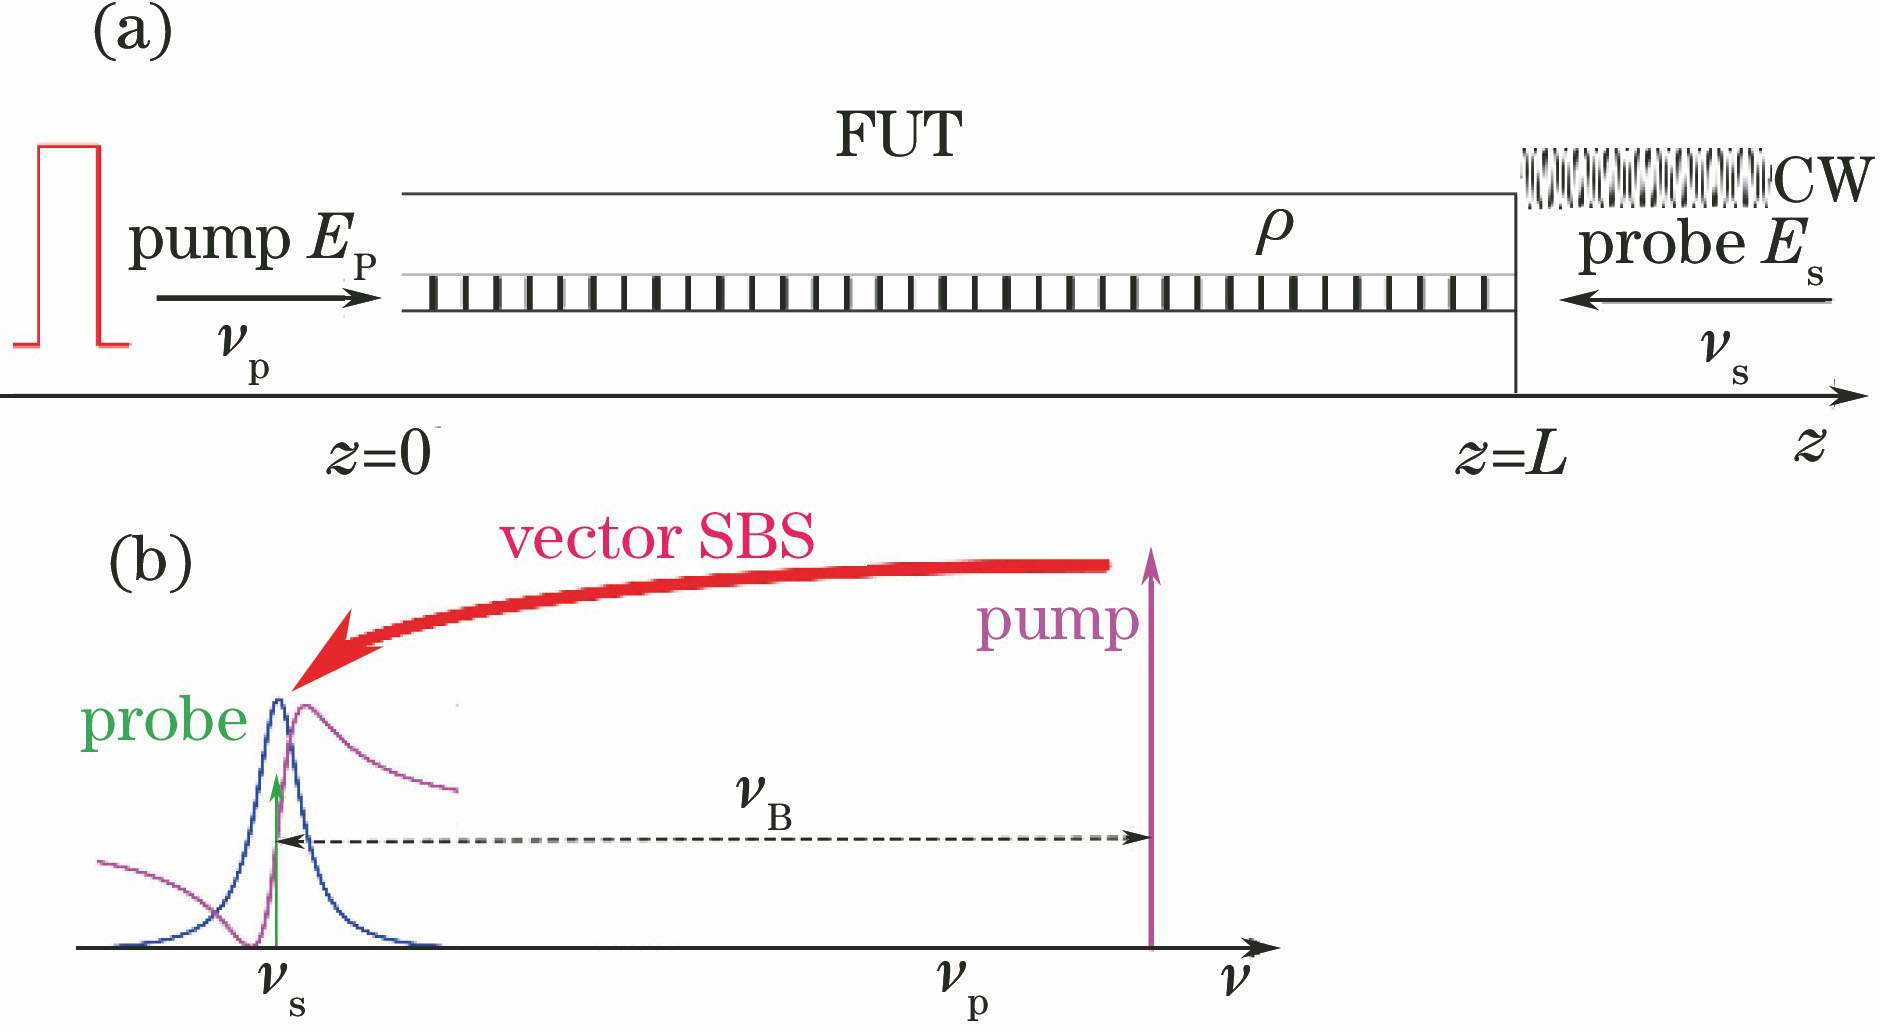
Fig. 1. Schematic of classical BOTDA system. (a) Time-domain relationship; (b) frequency-domain relationship
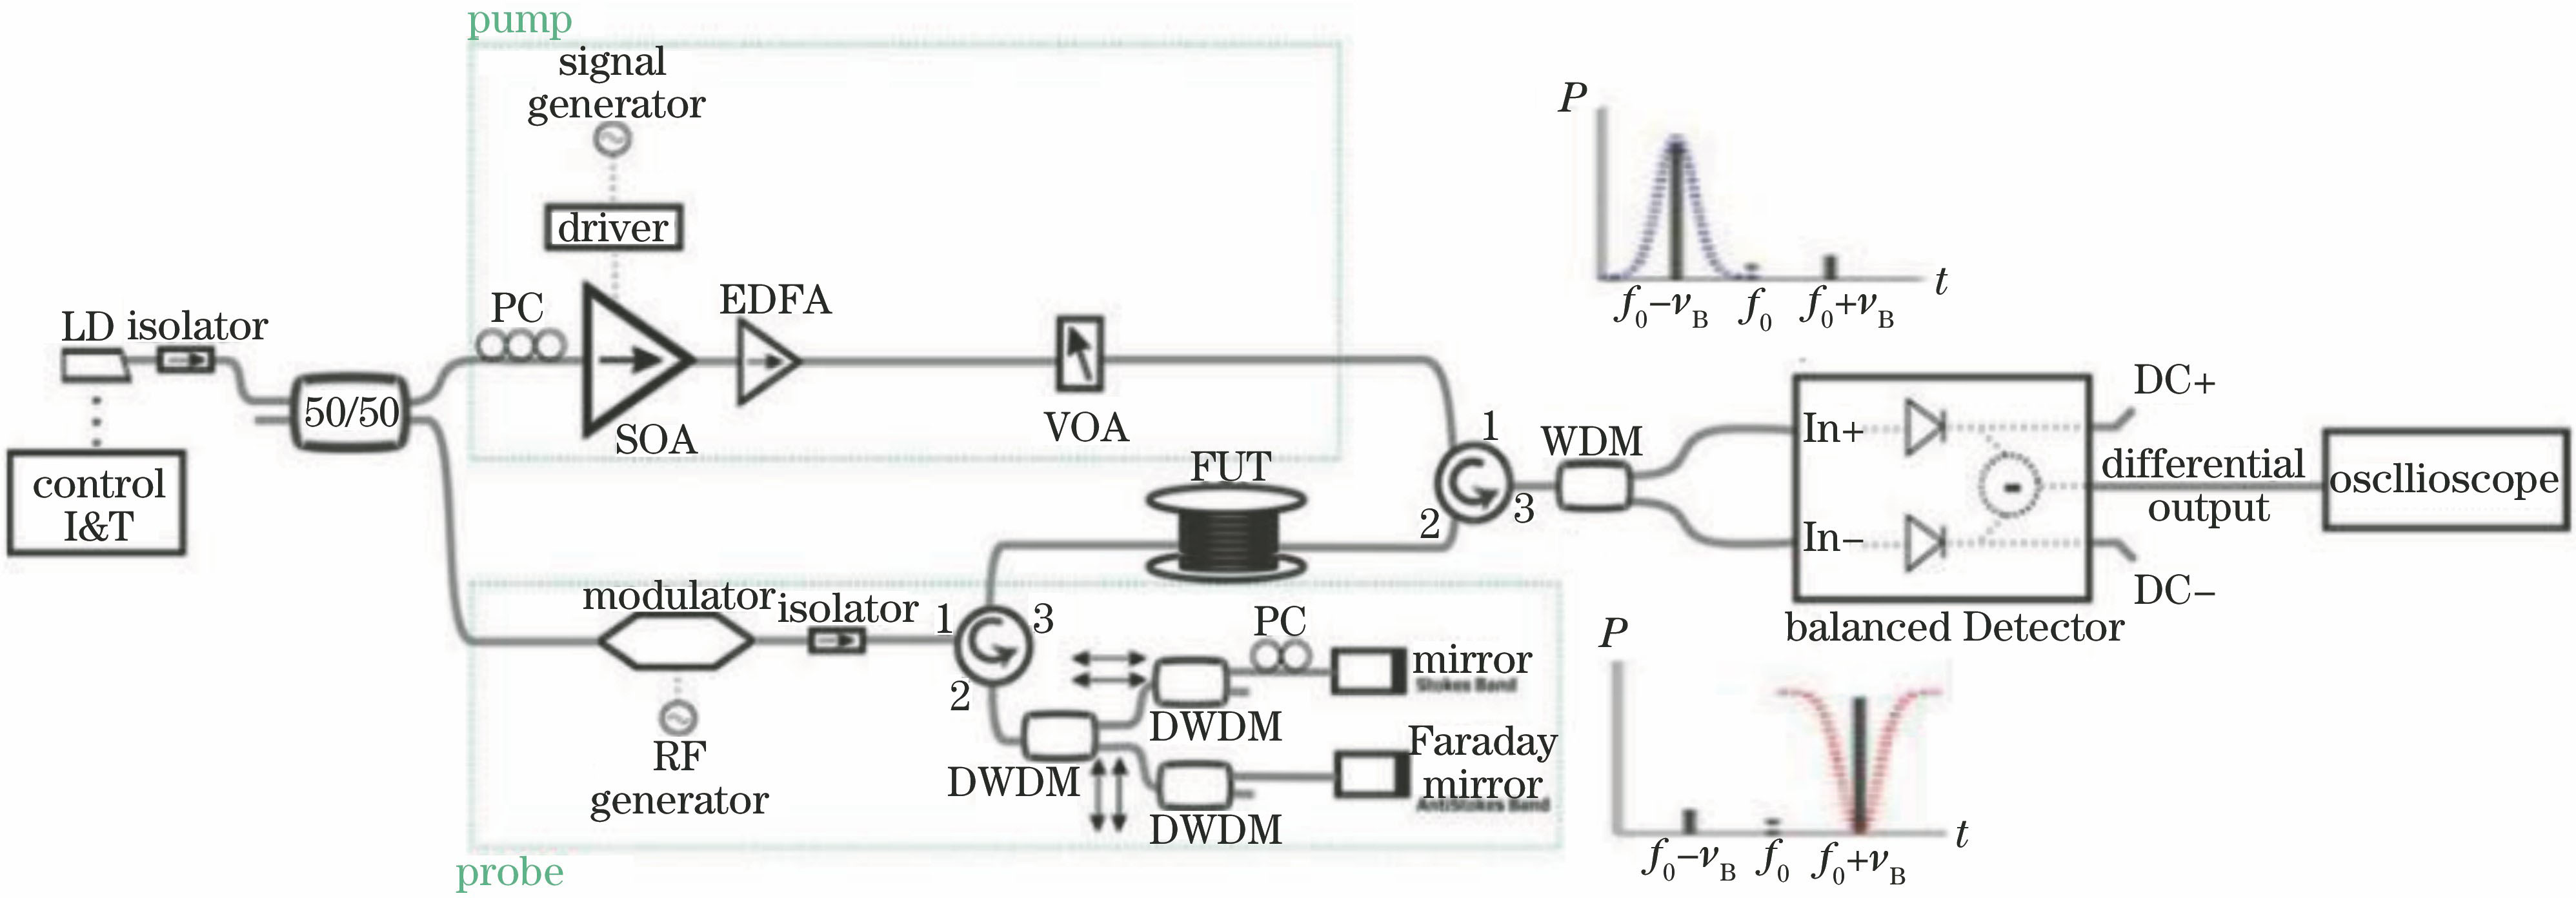
Fig. 2. Experimental setup of BOTDA system with balanced detection and polarization noise elimination
Fig. 3. Experimental results of BOTDA system with balanced detection and polarization noise elimination. (a) Brillouin gain trace obtained using single-detector (blue), Brillouin attenuation trace obtained using single-detector (red), and synthetic Brillouin trace obtained using balanced-detector (green); (b) local large diagram of the three traces around 25 km
Fig. 4. Experimental results of fast-acquisition measurement of the strain based on polarization compensation
Fig. 5. Schematic of fast BOTDA system based on FAT. (a) Probe wave modulated by FAT; (b) pump pulse modulated by FAT
Fig. 6. Second-order sideband modulation
Fig. 7. Measurements of the vibration signals. (a) Evolution of the measured BGS of the vibrated section of fiber; (b) vibration waveforms of the strain; (c) power spectra of the vibration waveforms of the strain
Fig. 8. Schematic of the frequency-agile technique based on dual-modulation scheme
Fig. 9. Schematic of SA-BOTDA system. (a) Operation principle of slope-assisted method; (b) comparison of strain vibration waveforms measured by slope-assisted method and curve fitting method; (c) dynamic strain in the spectral domain for different vibration frequencies
Fig. 10. Schematic of multi-slope-assisted F-BOTDA system. (a) Frequency-domain relationship of pump and probe waves of multi-slope-assisted F-BOTDA, and basic idea of the extension of measurement range; (b) time-domain relationship of pump and probe waves of multi-slope-assisted F-BOTDA
Fig. 11. Experimental measurement results of BFS strain vibration waveforms obtained via multi-slope-assisted method (blue solid curve) and traditional curve-fitting method (red dotted curve) in varios frequency-intervals. (a) 20, (b) 40, (c) 60, and (d) 80 MHz
Fig. 12. Simulation diagram of normalized spectra with the pump pulse width from 1 ns to continuous wave (ΔνB=30 MHz). (a) normalized BGS; (b) normalized BPSS; (c) normalized KS
Fig. 13. Time-domain relationship of pump wave and probe wave for multi-slope-assisted method
Fig. 14. Experimental results of BFS strain vibration waveforms, in which two kinds of reference strain vibration waveforms are curve-fitted based on the BGS (black scatter) and KS (blue scatter) respectively, meanwhile the strain vibration waveforms(red solid curve) are demodulated via F-BOTDA system in various frequency-intervals. (a) 80, (b) 120, (c) 160, and (d) 180 MHz
Fig. 15. Schematic of OCC-BOTDA system. (a) Time-domain relationship; (b) frequency-domain relationship
Fig. 16. Measurement of BGS via OCC-BOTDA system. (a) Distributed BGS measured by single shot of pump pulse wave; (b) various BGS for different strain changes
Fig. 17. Experimental results of mechanical shocks via OCC-BOTDA system. (a) Evolution of BGS processed by twice correlation algorithm; (b) demodulated strain vibration waveforms
Fig. 18. Experimental results of the switch event via OCC-BOTDA system: evolution of BGS processed by twice correlation algorithm for various conditions. (a) 200 times averaging; (b) no averaging; (c) demodulated BFS changes over time
Fig. 19. Schematic of SF-BOTDA system. (a) BOTDA system based on optical frequency comb; (b) SF-BOTDA system
Fig. 20. Schematic of single-shot BOTDA system. (a) Subcarriers of OFDM signal in frequency domain; (b) dual-polarized double-sideband OFDM probe; (c) pump and probe interaction and Brillouin spectrum extraction; (d) BGS and BLS after SBS process
Fig. 21. Reconstructed Brillouin spectrograms based on the measurement experimental results of static temperature. (a) x-polarization; (b) y-polarization; (c) combined dual-polarization; (d) measured data and Lorentzian fitting curves of marker A, B, C in (c)

Set citation alerts for the article
Please enter your email address
© Copyright 2018-2021 | Chinese Laser Press. All Rights Reserved 沪ICP备15018463号-20