Author Affiliations
1College of Intelligence and Information Engineering, Shandong University of Traditional Chinese Medicine, Jinan 250355, Shandong, China2First Clinical Medical College, Shandong University of Traditional Chinese Medicine, Jinan 250355, Shandong, Chinashow less
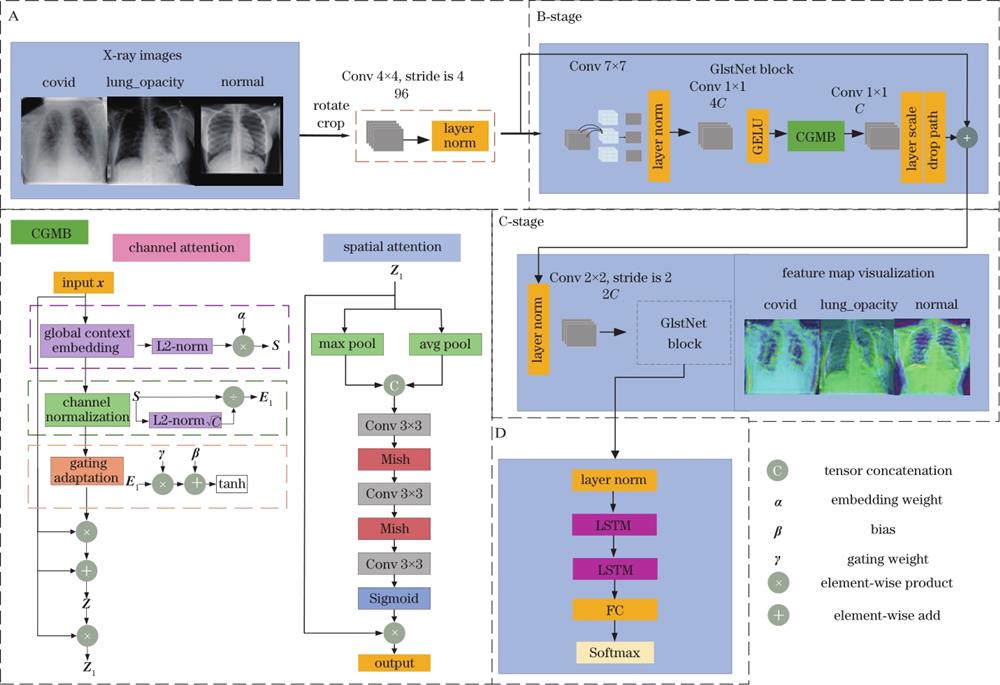
Fig. 1. GlstNet framework structure
Fig. 2. LSTM network structure
Fig. 3. CNN-LSTM network structure
Fig. 4. Confusion matrix for the test set on dataset I
Fig. 5. GlstNet accuracy change curve with confusion matrix
Fig. 6. GlstNet network confusion matrix on Chest X-ray validation set
Fig. 7. Score-CAM visualization results
Dataset | Type | Total | Training image | Validation image | Test image |
---|
COVID-19 Radiography Database | covid | 3616 | 2314 | 578 | 724 | normal | 8851 | 5664 | 1416 | 1771 | lung_opacity | 6012 | 3847 | 962 | 1203 |
|
Table 1. Division of dataset I
Dataset | Type | Total | Training image | Validation image |
---|
Chest X-ray | covid | 576 | 460 | 116 | normal | 1583 | 1266 | 317 | pneumonia | 4273 | 3418 | 855 |
|
Table 2. Division of dataset Ⅱ
No. | Model | Raccuracy /% | Rprecision /% | Rrecall /% | ΔRaccuracy/% |
---|
1 | Baseline | 94.00 | 94.80 | 94.00 | | 2 | Baseline+CBAM | 92.00 | 92.80 | 91.50 | ↓2.0 | 3 | Baseline+GCT+SA | 90.50 | 91.20 | 89.90 | ↓4.0 | 4 | Baseline+ST+MCSA | 92.80 | 93.20 | 92.63 | ↓1.2 | 5 | Baseline+CGMB | 95.00 | 95.70 | 95.00 | ↑1.0 | 6 | GlstNet | 95.60 | 96.03 | 95.76 | ↑1.6 |
|
Table 3. Test set metrics on dataset I
Model | Raccuracy /% | Rprecision /% | Rrecall /% |
---|
ResNet18[27] | 93.43 | 93.43 | 93.43 | ResNet50[27] | 93.01 | 93.12 | 93.02 | ResNet101[27] | 93.01 | 93.04 | 93.01 | ChexNet[27] | 93.21 | 93.28 | 93.21 | DenseNet201[27] | 92.70 | 92.78 | 92.70 | InceptionV3[27] | 93.46 | 93.49 | 93.47 | ConvNeXt | 94.00 | 94.80 | 94.00 | Vision Transformer | 94.64 | 95.23 | 94.63 | Swim Transformer | 95.18 | 95.66 | 95.23 | GlstNet | 95.60 | 96.03 | 95.76 |
|
Table 4. Comparison of GlstNet network with mainstream algorithms
Type | Raccuracy /% | Rprecision /% | Rrecall /% |
---|
covid | 98.50 | 97.50 | 99.60 | normal | 94.10 | 93.80 | 97.20 | lung_opacity | 95.50 | 96.00 | 95.80 |
|
Table 5. Performance metrics for three categories on the validation set of dataset Ⅰ
Model | Raccuracy /% | Rprecision /% | Rrecall /% |
---|
ALEXNET CNN[30] | 94.70 | 94.00 | 94.00 | LENET CNN[30] | 93.20 | 93.00 | 93.00 | DenseNet-169[30] | 95.70 | | | ResNet-50[31] | 93.30 | | | DenseNet[32] | 95.03 | 94.91 | 94.24 | EfficientNet[32] | 93.40 | 93.62 | 91.07 | VGG-16[32] | 92.08 | 92.02 | 92.77 | GlstNet | 97.20 | 97.03 | 97.60 |
|
Table 6. Comparison of GlstNet with mainstream algorithms
Type | Raccuracy/% | Rprecision /% | Rrecall /% |
---|
covid | 100.00 | 99.10 | 100.00 | normal | 92.40 | 96.50 | 97.40 | pneumonia | 98.70 | 97.20 | 97.50 |
|
Table 7. Performance metrics for three categories on the validation set of dataset II