
Lei Zhang, Xiaoming Chen, Wei Liu, Zhipeng Jiang, Peng Zhao, Deyou Liu. Formation Mechanism and Sensitivity of Cracks in Laser-Cladded Ni-Based-Alloy Coatings[J]. Laser & Optoelectronics Progress, 2019, 56(11): 111401
- Laser & Optoelectronics Progress
- Vol. 56, Issue 11, 111401 (2019)
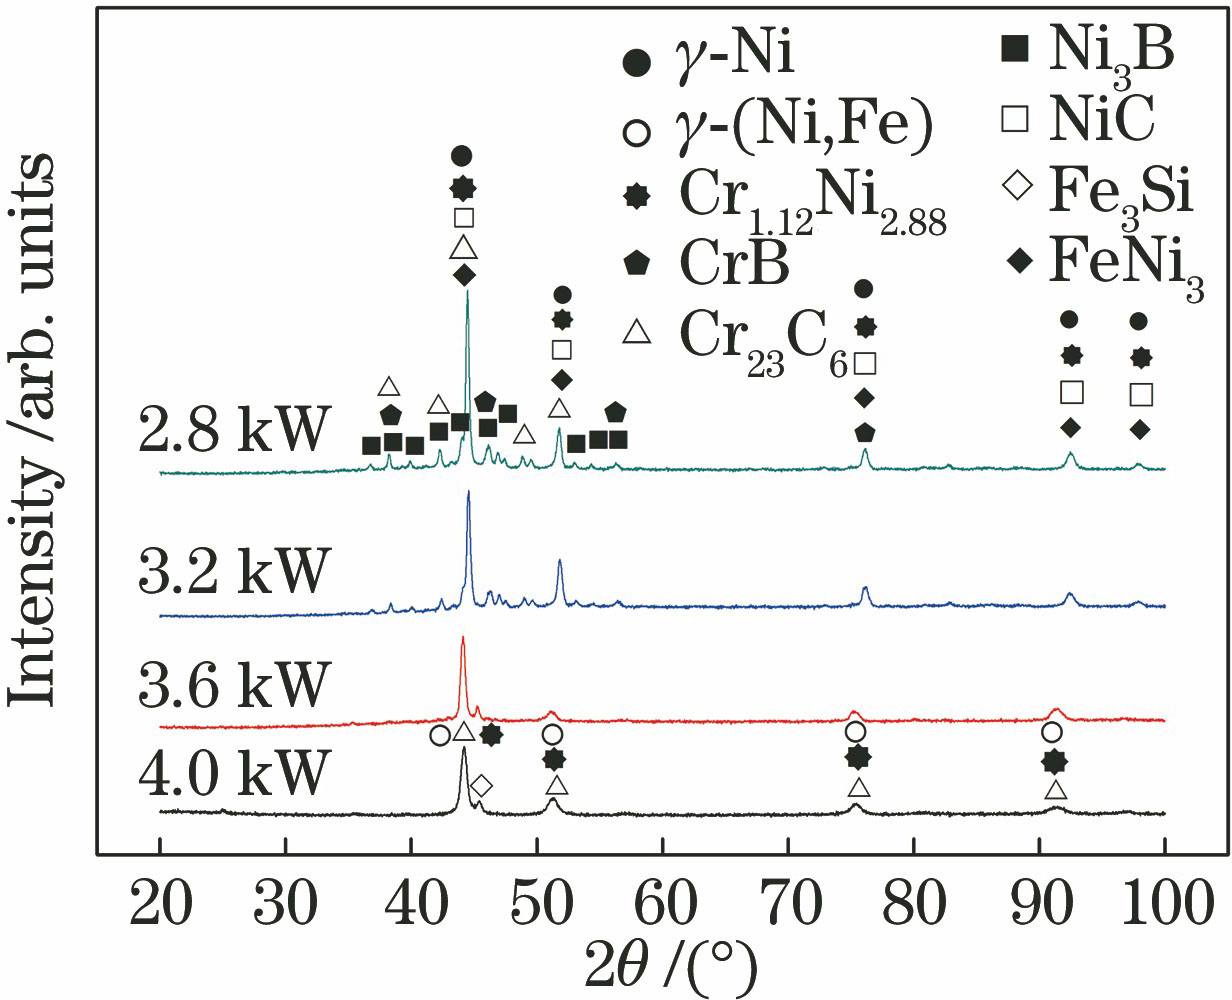
Fig. 1. XRD patterns of laser cladded Ni-based-alloy coatings
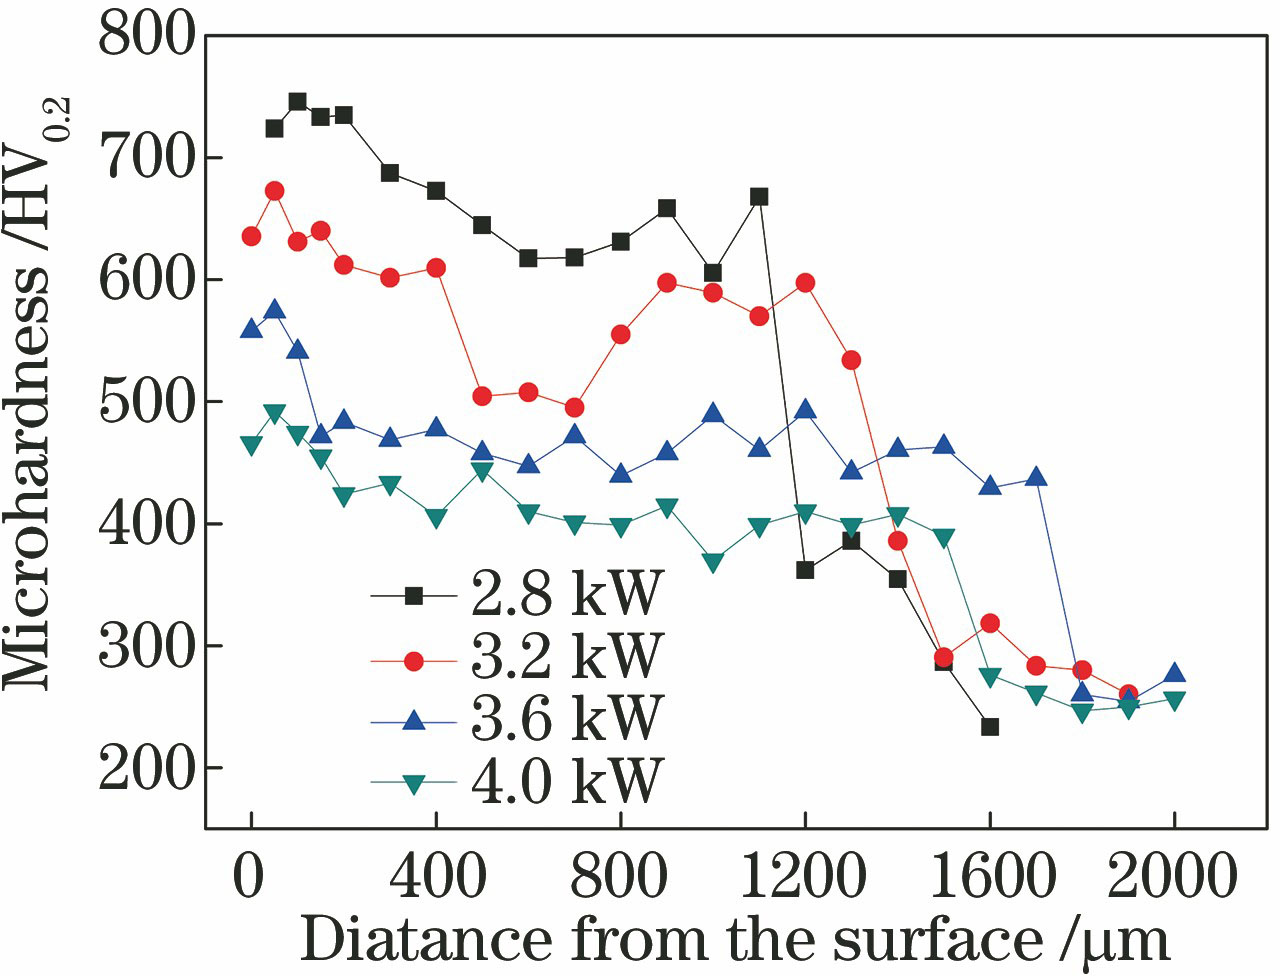
Fig. 2. Microhardness distribution in cross section of Ni-based-alloy coating
Fig. 3. Macro-morphologies of cracks in laser cladded Ni-based-alloy coatings. (a) 2.8 kW; (b) 3.2 kW; (c) 3.6 kW; (d) 4.0 kW
Fig. 4. Microstructure of cross-section of Ni-based-alloy coating and crack micro-morphology. (a) Overall morpholog; (b) morphology and microstructure of cross-section; (c) coarse crack; (d) microcrack
Fig. 5. Fracture morphology of crack in laser cladded Ni-based-alloy coating. (a) Overall fracture morphology; (b) river pattern of fracture surface; (c)(d)tearing ridge of fracture surface
Fig. 6. SEM morphology of crack and element distribution in laser cladded Ni-based-alloy coating. (a) SEM morphology; (b) Ni; (c) Cr; (d) Fe; (e) B; (f) C
Fig. 7. Effects of laser cladding process factors on cracking sensitivity (The rulers represent 10 mm). (a) Laser power (V=10 mm/s, Q=25.9 g/min, and T=100 ℃); (b) powder feeding rate (P=2.8 kW, V=10 mm/s, and T=100 ℃); (c) scanning speed (P=4.0 kW, Q=25.9 g/min, and T=100 ℃); (d) preheating temperature (P=2.8 kW, Q=22.7 g/min, and V=10 mm/s)
|
Table 1. Chemical compositions of alloy powder and base material (mass fraction, %)
|
Table 2. Compositional analysis by EDS (mass fraction, %)

Set citation alerts for the article
Please enter your email address
© Copyright 2018-2021 | Chinese Laser Press. All Rights Reserved 沪ICP备15018463号-20