• Spectroscopy and Spectral Analysis
  • Vol. 40, Issue 10, 3271 (2020)
Lu WANG1、1, Hai-ou GUAN1、1, Wei-kai LI1、1, Zhi-chao ZHANG1、1, Ming ZHENG1、1, Song YU1、1, and Yu-long HOU1、1
Author Affiliations
  • 1[in Chinese]
  • 11. College of Electrical and Information, Heilongjiang Bayi Agricultural University, Daqing 163319, China
  • show less
    DOI: 10.3964/j.issn.1000-0593(2020)10-3271-06 Cite this Article
    Lu WANG, Hai-ou GUAN, Wei-kai LI, Zhi-chao ZHANG, Ming ZHENG, Song YU, Yu-long HOU. Analysis and Detection Method of NIR Spectral Characteristics of Kidney Bean Canopy Under Saline-Alkali Stress[J]. Spectroscopy and Spectral Analysis, 2020, 40(10): 3271 Copy Citation Text show less
    Kidney bean experiment scene(a): Hydroponics of kidney bean live; (b): Obtaining spectral curve of kidney bean by near infrared spectrometer
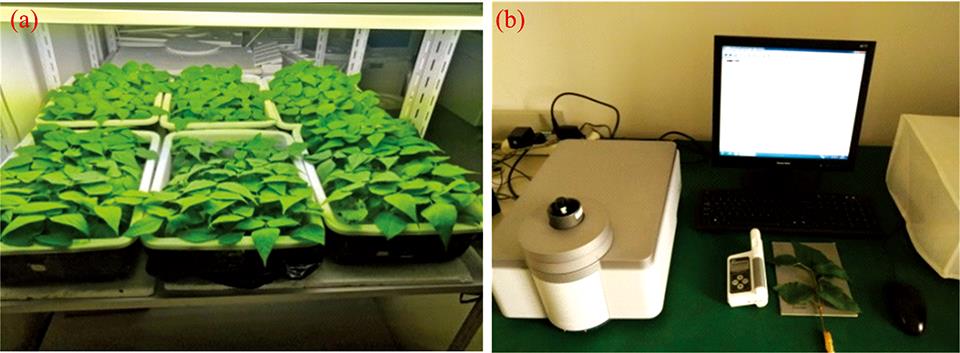
    Fig. 1. Kidney bean experiment scene
    (a): Hydroponics of kidney bean live; (b): Obtaining spectral curve of kidney bean by near infrared spectrometer
    Distribution of mahalanobis distances of 524 kidney bean samples
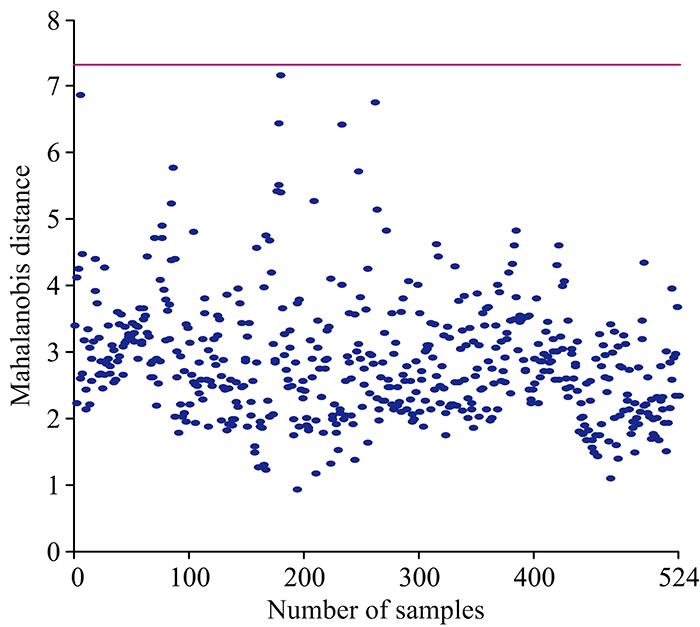
    Fig. 2. Distribution of mahalanobis distances of 524 kidney bean samples
    Near infrared spectra of kidney bean samples
    Fig. 3. Near infrared spectra of kidney bean samples
    Average spectral absorbance curves of 7 types of kidney bean samples
    Fig. 4. Average spectral absorbance curves of 7 types of kidney bean samples
    Near infrared spectra of kidney bean canopy pretreated by DT
    Fig. 5. Near infrared spectra of kidney bean canopy pretreated by DT
    Extraction of characteristic wavelength by CARS
    Fig. 6. Extraction of characteristic wavelength by CARS
    Extraction of characteristic wavelength by SPA(a): Number of filter variables; (b): Distribution of characteristic wavelengths
    Fig. 7. Extraction of characteristic wavelength by SPA
    (a): Number of filter variables; (b): Distribution of characteristic wavelengths
    Contrast of convergence speed of networks(a): BP neural network; (b): RBF neural network
    Fig. 8. Contrast of convergence speed of networks
    (a): BP neural network; (b): RBF neural network
    光谱类型PLSR建模参数PCR建模参数
    RMSECRcRMSEPRpRMSECRcRMSEPRp
    原始光谱(RAW)0.781 80.930 70.736 30.933 81.974 90.381 61.905 60.492 2
    平滑光谱(SG)0.801 70.926 90.747 50.931 71.974 90.381 61.905 60.492 2
    校正光谱(MSC)0.758 20.934 90.694 30.941 41.955 00.403 41.853 90.543 0
    正态光谱(SNV)0.793 40.928 50.739 30.933 81.392 60.758 41.365 90.764 6
    标准光谱(STA)0.796 90.927 80.958 10.882 81.526 20.699 81.603 70.637 6
    去趋光谱(DT)0.692 10.946 10.677 00.943 32.009 70.339 41.948 20.469 0
    均值光谱(MEAN)0.781 70.930 70.737 10.933 91.974 90.381 61.905 60.492 2
    归一光谱(NOR)0.742 70.937 60.709 50.937 41.458 70.730 71.406 00.731 1
    Table 1. The salt-alkali stress pretreatment model obtained by PLSR and PCR analysis
    模型特征波
    长个数
    校正集预测集
    RMSECRcRMSEPRp
    DT-PLSR1 4630.692 10.946 10.677 00.943 3
    CARS-PLSR950.904 90.905 91.061 70.853 5
    SPA-PLSR171.247 90.811 71.240 80.805 1
    Table 2. Comparison of three modeling methods
    模型网络结构学习
    次数
    准确率
    /%
    均方误差
    RAW-RBF1463-335-733588.640.009 953 63
    DT-RBF1463-250-725095.450.009 992 83
    CARS-RBF95-282-728297.730.009 938 59
    CARS-BP95-170-760 00095.450.039 300 00
    Table 3. The performance index of salt and alkali stress detection model of kidney bean
    Lu WANG, Hai-ou GUAN, Wei-kai LI, Zhi-chao ZHANG, Ming ZHENG, Song YU, Yu-long HOU. Analysis and Detection Method of NIR Spectral Characteristics of Kidney Bean Canopy Under Saline-Alkali Stress[J]. Spectroscopy and Spectral Analysis, 2020, 40(10): 3271
    Download Citation