• Chinese Optics Letters
  • Vol. 21, Issue 2, 023001 (2023)
Xin Peng1, Minsun Chen1、2, and Hao Liu1、2、*
Author Affiliations
  • 1College of Advanced Interdisciplinary Studies, National University of Defense Technology, Changsha 410073, China
  • 2State Key Laboratory of Pulsed Power Laser Technology, Changsha 410073, China
  • show less
    DOI: 10.3788/COL202321.023001 Cite this Article Set citation alerts
    Xin Peng, Minsun Chen, Hao Liu. Optical emission spectrometric diagnosis of laser-induced plasma and shock front produced at moderate pressure[J]. Chinese Optics Letters, 2023, 21(2): 023001 Copy Citation Text show less
    Sketch of the experiment setup.
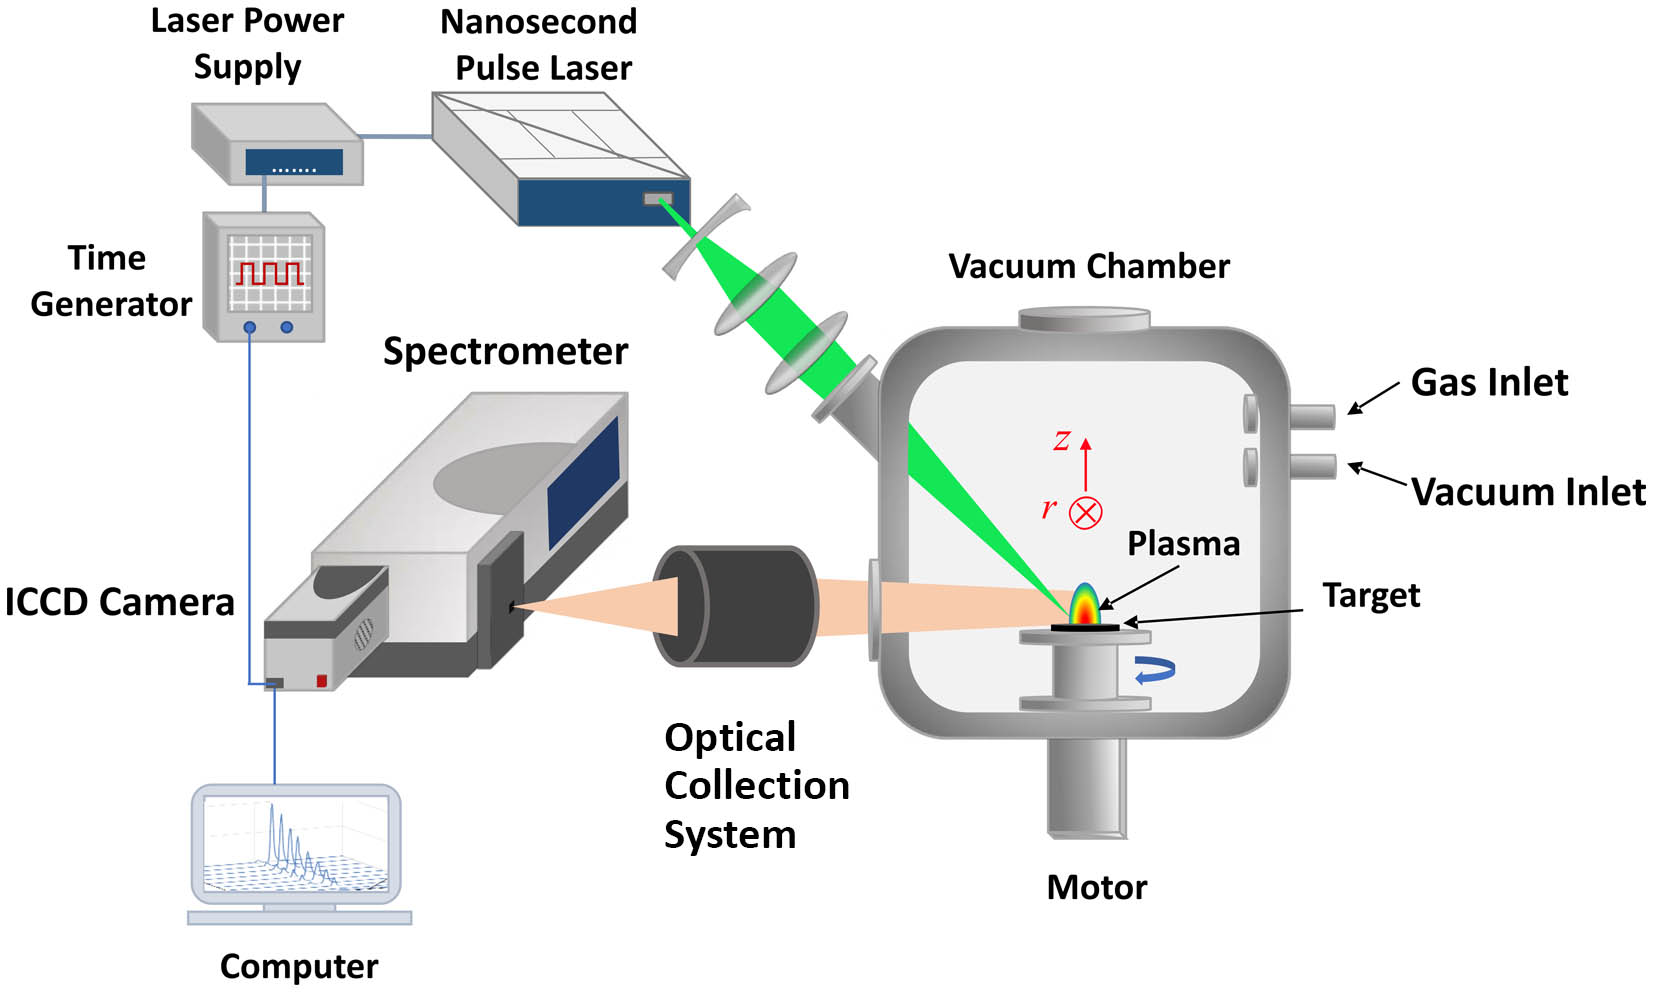
    Fig. 1. Sketch of the experiment setup.
    Optical emission images in ambient Ar with pressure of 20 Pa. The logarithmic false color intensity scale is shown at the right of the image.
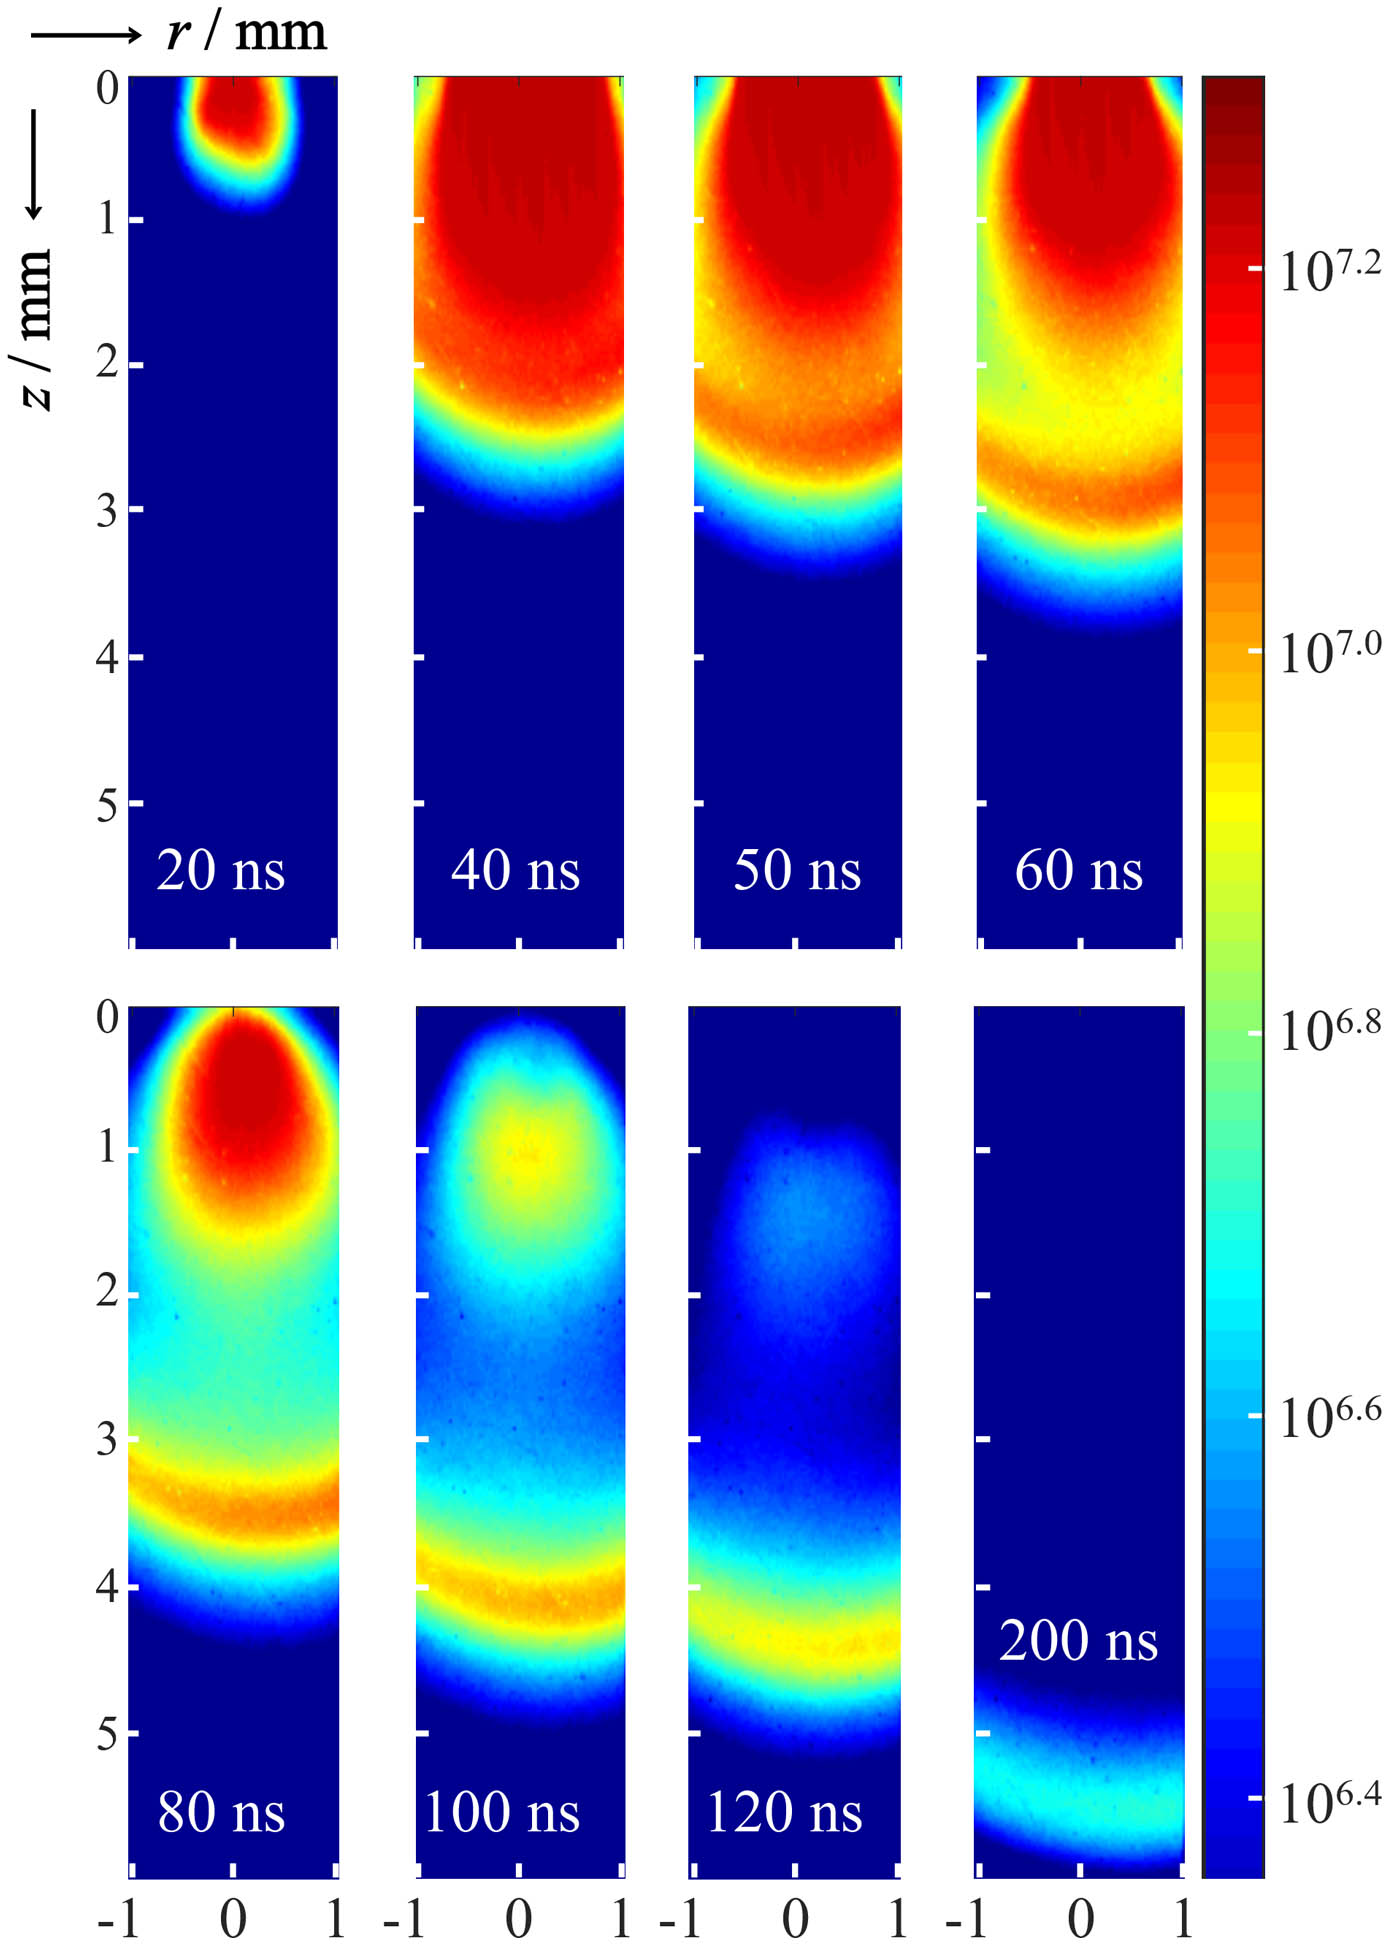
    Fig. 2. Optical emission images in ambient Ar with pressure of 20 Pa. The logarithmic false color intensity scale is shown at the right of the image.
    (a) Spatial distributions of emission intensity at different time delays via vertical cuts along the z axis within −0.05 ≤ r ≤ 0.05 mm through such images as Fig. 2; (b) temporal evolution of the shock front position z derived from the experimental data (black spheres) along with the line of best-fit, assuming z ∝ tb.
    Fig. 3. (a) Spatial distributions of emission intensity at different time delays via vertical cuts along the z axis within −0.05 ≤ r ≤ 0.05 mm through such images as Fig. 2; (b) temporal evolution of the shock front position z derived from the experimental data (black spheres) along with the line of best-fit, assuming ztb.
    Emission spectra measured at the pressure of 10−5 Pa (top row), 2 Pa (middle row), and 20 Pa (bottom row). These images show the evolving spatial distribution at Δt = 40 ns (left column) and 70 ns (right column).
    Fig. 4. Emission spectra measured at the pressure of 10−5 Pa (top row), 2 Pa (middle row), and 20 Pa (bottom row). These images show the evolving spatial distribution at Δt = 40 ns (left column) and 70 ns (right column).
    Emission spectra at Δt = 70 ns obtained by taking horizontal cuts through the 10−5 Pa image in Fig. 4 at z = 0.8 mm (top left panel) and 3 mm (top right panel) and the 20 Pa image at z = 0.8 mm (bottom left panel) and 3 mm (bottom right panel).
    Fig. 5. Emission spectra at Δt = 70 ns obtained by taking horizontal cuts through the 10−5 Pa image in Fig. 4 at z = 0.8 mm (top left panel) and 3 mm (top right panel) and the 20 Pa image at z = 0.8 mm (bottom left panel) and 3 mm (bottom right panel).
    (a) Spatial distribution of Si II 488.320 nm (red), Si III 455.262 nm (blue), and Si IV 465.432 nm (magenta) emission lines measured at Δt = 40 ns with pressure of 2 Pa; (b) z-dependent intensities of Si IV 465.432 nm (2p66h1–2p65g1 transition) at the pressure of 0.5, 10, 20, 50, and 100 Pa when Δt = 40 ns; (c) the evolution of the front position with pressure p at Δt = 40 and 70 ns; (d) the evolution of the average velocity with pressure p at Δt = 40 and 70 ns.
    Fig. 6. (a) Spatial distribution of Si II 488.320 nm (red), Si III 455.262 nm (blue), and Si IV 465.432 nm (magenta) emission lines measured at Δt = 40 ns with pressure of 2 Pa; (b) z-dependent intensities of Si IV 465.432 nm (2p66h1–2p65g1 transition) at the pressure of 0.5, 10, 20, 50, and 100 Pa when Δt = 40 ns; (c) the evolution of the front position with pressure p at Δt = 40 and 70 ns; (d) the evolution of the average velocity with pressure p at Δt = 40 and 70 ns.
    Representative energy levels of Si and Ar considered in this paper.
    Fig. 7. Representative energy levels of Si and Ar considered in this paper.
    Spatial distribution of Ne and Te derived from the spectra of plasma produced by laser ablation at a pressure of 20 Pa when Δt = 40 ns (black) and 70 ns (red).
    Fig. 8. Spatial distribution of Ne and Te derived from the spectra of plasma produced by laser ablation at a pressure of 20 Pa when Δt = 40 ns (black) and 70 ns (red).
    Xin Peng, Minsun Chen, Hao Liu. Optical emission spectrometric diagnosis of laser-induced plasma and shock front produced at moderate pressure[J]. Chinese Optics Letters, 2023, 21(2): 023001
    Download Citation