
Xin Peng, Minsun Chen, Hao Liu. Optical emission spectrometric diagnosis of laser-induced plasma and shock front produced at moderate pressure[J]. Chinese Optics Letters, 2023, 21(2): 023001
- Chinese Optics Letters
- Vol. 21, Issue 2, 023001 (2023)
Abstract
1. Introduction
Pulsed laser ablation (PLA) has received extensive attention over the last two decades with applications in various fields like film deposition, nanoparticles fabrication, high precision laser processing, environmental analysis, surgery treatment, pulsed laser propulsion, etc.[1–5]. Despite the popularity of PLA, the mechanisms of laser ablation are obscured by coupled interactions of laser-plasma, laser-target, and plasma-ambient gas, ranging from super heated target surface emission to fast evolving plasma produced at vaccum or moderate pressure[6]. The hydrodynamic model[7] was found as an appropriate method to simulate the plasma at surrounding pressures of . The previous researchers also managed to experimentally explore ambient pressure influence on laser-induced plasma (LIP). Harila et al.[8,9] reported the background pressure-dependent LIPs expansion features, suggesting the spectra signal-to-noise improvement at a pressure level of . Cowpe et al.[10] concluded on the LIP plume expansion process variation with ambient gas pressure based on dynamics of electron density and temperature. Although the laser-target[11] and laser-plasma interactions[12] were investigated by numerical simulation and experimental measurements, the quantitative analysis of plasma-ambient gas interaction at pressures of 1–100 Pa is still needed for better understanding of laser ablation and for subsequent technology development applied at moderate pressure (e.g., pulsed laser propulsion in near space, pulsed laser deposition to fabricate functional nanofilms). This work presents experimental investigation of LIPs by using the optical emission spectroscopy (OES) method to demonstrate the interaction between plume and background gas based on the spatial and temporal evolution of LIPs and electron density and temperature obtained by spectra analysis.
The spatial and temporal evolving electron density () and temperature () provide insights into the physics of LIPs. The observation methods proposed by existing research works, including Thomson scattering[13], Langmuir probe[14], laser interferometry[15], etc., have both merits and drawbacks. Laser interferometric studies and Thomson scattering, for instance, are capable of obtaining plasma information, but the accuracy can be reduced by probe laser-induced heating effects[16]. As a non-contact optical measurement technique, OES is an alternative route to such quantitative parameters of LIPs[17].
2. Experiment
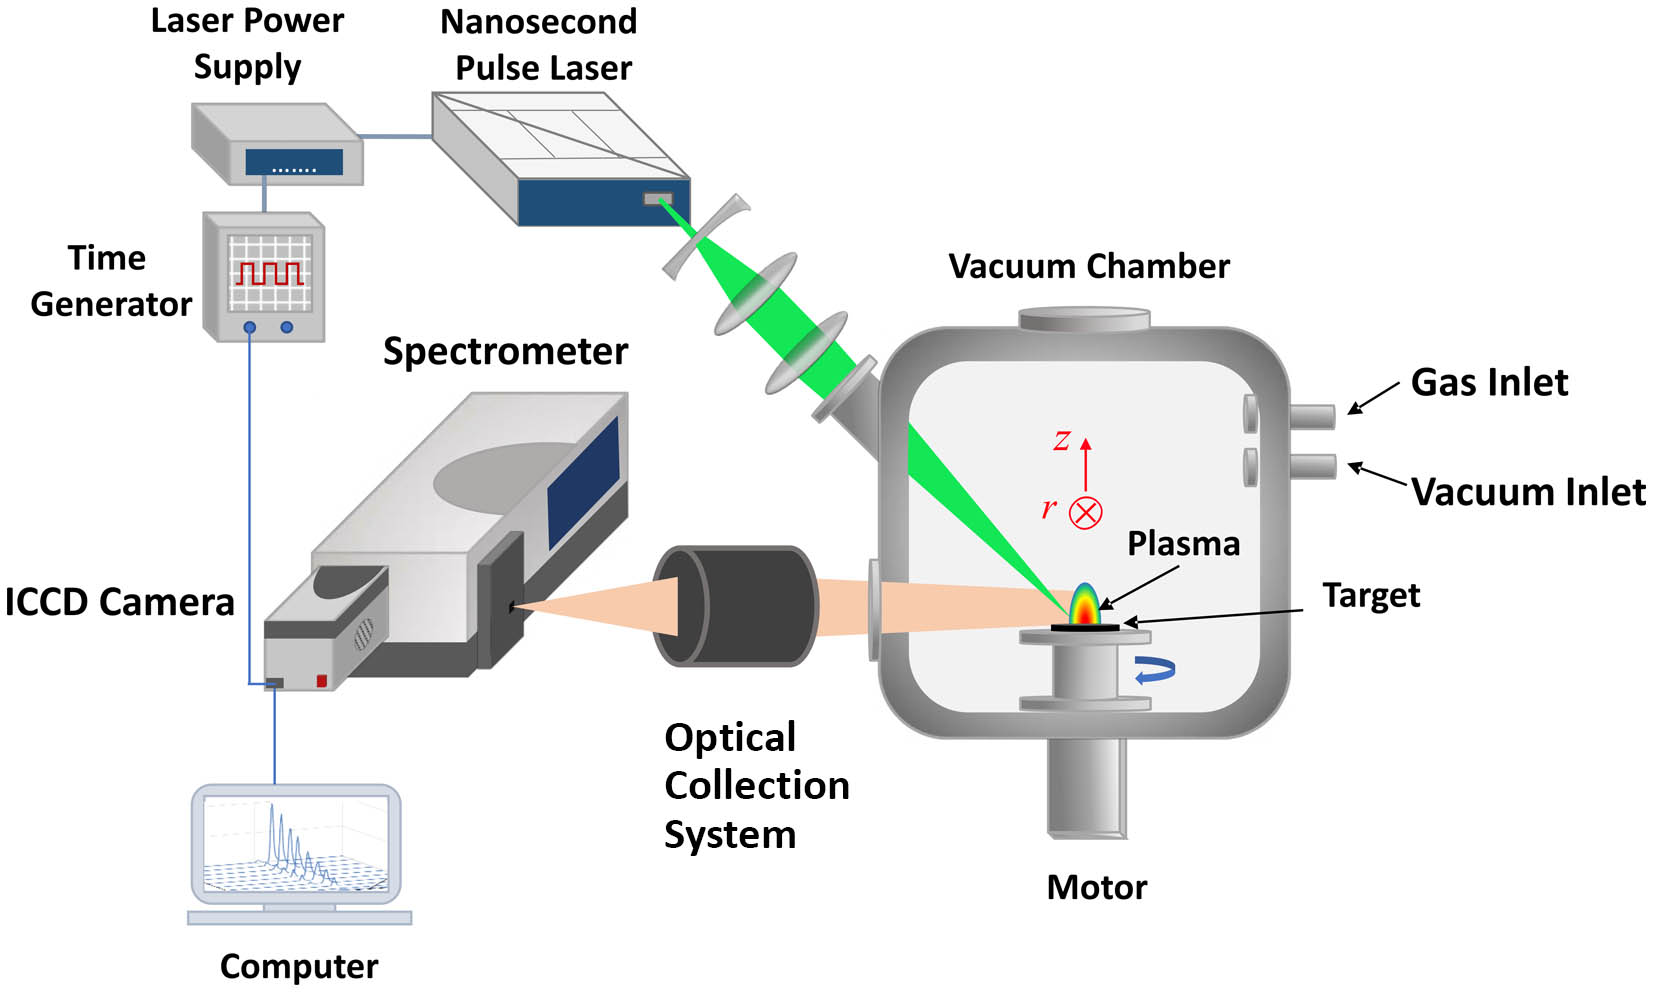
In this work, the diagnosis system is schematically illustrated in Fig. 1. The laser with a wavelength of 532 nm was focused onto the surface of a silicon (Si) target with the incident angle of 45 deg in the vacuum chamber. The beam output with durations of (FWHM) was operated at a repetition rate of 10 Hz and was directly focused using a focusing lens (). The 2 in. diameter circular target (Si) was fixed on a rotated pedestal at the speed of 10 r/min to ensure that each laser pulse irradiates onto fresh surface areas of the target. The pressure of the experiments in this work is and 0.5–100 Pa with ambient argon (Ar).
Sign up for Chinese Optics Letters TOC. Get the latest issue of Chinese Optics Letters delivered right to you!Sign up now
![]()
Figure 1.Sketch of the experiment setup.
Optical emissions from the plasma plume, collected by the imaging system, are recorded by a time-gated intensified charge coupled device (iCCD) camera after wavelength resolution via a spectrometer. The time gate width is set as 5 ns, and the time zero is defined as the moment when the laser beam arrives at the target surface. The spatio-spectral images are measured at different time delays with the signal during the time period from to .
3. Results and Discussion
The 2D spatial images at multiple time delays with pressure of 20 Pa are shown in Fig. 2. The images show the evolving spatial distribution of the total emission in the range measured at selective time delays from 20 to 200 ns. The horizontal scale is direction parallel to the target surface, and the vertical scale is direction normal to the surface [both in units of millimeters (mm), with the laser incident at ]. This figure and all subsequent false color images are displayed using a logarithmic intensity scale at the right of each picture. These spatial distributions illustrate the expansion of the plasma plume away from the focal spot on the surface, which defines .
![]()
Figure 2.Optical emission images in ambient Ar with pressure of 20 Pa. The logarithmic false color intensity scale is shown at the right of the image.
The front edge of the expanding electron and fast ions is compressed by the ambient Ar. During the strong collision process, a thin transition layer develops, in which the density, pressure, etc. are changing rapidly between the plasma species and the background gas. This boundary at the leading edge of the plume is usually called a shock front. The shock front relaxes from to 6 mm within 200 ns at the ambient pressure of 20 Pa.
Figure 3(a) shows the -dependent intensities observed by taking vertical cuts through optical emission images similar to those in Fig. 2 within at different time delays from 40 to 250 ns in the pressure of 20 Pa. The total intensity peaks at the core of the plasma plume, and then declines along the direction due to the plasma expansion. The background gas, however, confines the plume, and the shock layer starts forming, in which plenty of excited ions are produced by collisions, so the spatial distribution of the total emission intensity reaches the second peak at the shock front.
![]()
Figure 3.(a) Spatial distributions of emission intensity at different time delays via vertical cuts along the z axis within −0.05 ≤ r ≤ 0.05 mm through such images as Fig.
If the position of the shock wave is defined as the position where the emision intensity decays to the half of its maximal value in Fig. 3(a), the temporal evolution of the shock front is plotted as black spheres in Fig. 3(b).
The shock front position is described as the following by assuming a self-similar point blast model derived from the hemispherical expansion theory[18]:
Fitting the experimental data in terms of the function returns with goodness-of-fit , as the red line shown in Fig. 3(b). The plume expansion becomes progressively less hemispherical, resulting in the tiny deviation from the theoretical Eq. (1).
To obtain details about spectral carriers, the evolving spatial-temporal emission images I (, ; , ) are recorded at different ambient Ar pressures () and time delays (20–300 ns) in the range of . The selective images shown in Fig. 4 are recorded following 532 nm PLA (with an irradiance of ) onto a Si target at ambient pressure of (top row), 2 Pa (middle row), and 20 Pa (bottom row) using the 1200 lines/mm grating at time delays (left column) and 70 ns (right column). is the distance along the target surface normal, with defining the target surface. The logarithmic color bar inserted in the right of the images shows each line of emission intensity.
![]()
Figure 4.Emission spectra measured at the pressure of 10−5 Pa (top row), 2 Pa (middle row), and 20 Pa (bottom row). These images show the evolving spatial distribution at Δt = 40 ns (left column) and 70 ns (right column).
The spectra in the observed region are dominated by and emissions with several less luminous ion emissions (henceforth, respectively, referenced using spectroscopic notation as Si IV, Si III, and Si II) from the plasma produced at the pressure of , which are readily distinguished by their respective profiles.
It is worth noting the spatial fractionation among the different carriers and the finding that all spectral lines associated with a given species in a given charge state present the same spatial distribution. The dimension in the experimental images provided straightforward, visual access to the various emitters contributing to such -dispersed spectra. The higher velocities associated with higher charged species are in accord with expectations based on the plasma internal charge acceleration model[19], wherein the fastest electrons arising in the laser ablation process escape from the leading edge of the LIP, thereby establishing an electric field gradient with respect to the slightly net-positive bulk of the plume. This Coulomb force provides the strongest acceleration to the most highly charged species, which partition to the front edge of the expanding plume, are assumed to be least cooled by adiabatic process, and thus appear with the highest velocity.
As shown in Fig. 4, the expansion of the Si IV species (e.g., the transition, 465.432 nm), the highest charged state and the fastest ions observed in the plume expansion, are significantly compressed by Ar in the dimension with the increasing ambient pressure. The spatial distribution of the Si IV when at , for instance, is at the range of , while the Si IV ions at 20 Pa are compressed into the shock front layer, where , based on the position of maximum broadband emission, which at least includes multiplets of Si III, Si IV, and Ar II identified around 465 nm.
Such multi-dimensional data sets like Fig. 4 allow detailed analysis of plume dynamics. Horizontal cuts at given positions in these emission images yield wavelength resolved intensity spectra, as shown in Fig. 5. The emission lines are assigned in the figure by referring to the NIST Atomic Spectra Database[20].
![]()
Figure 5.Emission spectra at Δt = 70 ns obtained by taking horizontal cuts through the 10−5 Pa image in Fig.
Vertical cuts along the dimension in the emission images can also present quantification of the spatial distributions of each emitter at any time delay . Figure 6(a), for instance, shows the spatial distribution of Si II 488.320 nm (red), Si III 455.262 nm (blue), and Si IV 465.432 nm (magenta) emission lines, which are highlighted by a red star in the top row of Fig. 5, measured at following 532 nm laser ablation of a Si target in the ambient Ar with pressure of 2 Pa. Clearly, the Si IV profile is broader and peaks at larger than the corresponding Si III emission profile—as inferred from the spatial-spectral images shown in Fig. 4.
![]()
Figure 6.(a) Spatial distribution of Si II 488.320 nm (red), Si III 455.262 nm (blue), and Si IV 465.432 nm (magenta) emission lines measured at Δt = 40 ns with pressure of 2 Pa; (b) z-dependent intensities of Si IV 465.432 nm (2p66h1–2p65g1 transition) at the pressure of 0.5, 10, 20, 50, and 100 Pa when Δt = 40 ns; (c) the evolution of the front position with pressure p at Δt = 40 and 70 ns; (d) the evolution of the average velocity with pressure p at Δt = 40 and 70 ns.
The pressure-dependent spatial distributions of Si IV 465.432 nm ( transition) emission are also obtained in Fig. 6(b) by similar techniques. Since the Si IV is the highest charged and fastest expanding ion observed in the experimental measurements at the range of , the front position thus is defined here as the location where the Si IV emission intensity decays to half of its maximal value. The evolutions of the position and corresponding average velocity with pressure at and 70 ns are illustrated in Figs. 6(c) and 6(d). The ambient Ar atoms with increasing pressures confine and push the whole plume back, the plasma plume therefore becomes closer to the target surface, and the expansion velocity at higher pressures decelerates to half of it in high vacuum ().
At the pressure of 20 Pa, emission from the Si III species, which are expected to be behind the Si IV ions in the plume based on the internal Coulomb field acceleration, appears stretched and penetrates the shock front (recall Fig. 4). The Si III ions appearing at the most advanced positions are plausibly produced by such collisional processes as
If the energy of ground state neutral is defined as zero, the ground state energy of the Si IV ion () is larger than the sum of the ground state energies of Ar II and Si III (15.76 and 24.5 eV, respectively), so a Si IV ion is capable of ionizing an Ar atom to its excited state of Ar II and still has sufficient energy to leave itself in an excited state of Si III. These new Si III ions are produced around Si IV and inside the shock front, stretching the Si III subgroup along the direction. The minimum energies of possible states involved in such processes are listed in Fig. 7.
![]()
Figure 7.Representative energy levels of Si and Ar considered in this paper.
The emission of Si IV ions at large position vanishes with the pressure ascending by two possible routes: (i) collision with background Ar as the process of Eq. (2) and process
To figure out the dominant mechanism, we use the OES Stark broadening method to diagnose spatially and temporally resolved electron density () and temperature () values within the LIPs in these experiments. In this work, and are derived by using the Stark-broadened line shapes measured in Figs. 4 and 5, as previously[21],
Figure 8 shows the dependence of the electron density and temperature at different time delays. The values of and fall with increasing distance in the plume central area when , and the electrons become dense at , which is consistent with the position of the shock wave according to the bottom left image of Fig. 4, reaching maximal value at the shock wave layer, then declining with further distance . The possibility that electrons come from laser direct ionization has been excluded by experiments. Therefore, the frequent collisions between highly charged Si IV ions and ambient Ar atoms as described in Eq. (3) yield more electrons at the front edge of the plume, leading to the local peak of electron spatial distribution at the shock wave position when and 70 ns, which indicates that the collisional process dominates possible electron evolution in the region of the shock front and the vicinity.
![]()
Figure 8.Spatial distribution of Ne and Te derived from the spectra of plasma produced by laser ablation at a pressure of 20 Pa when Δt = 40 ns (black) and 70 ns (red).
The red line in the Fig. 8(a) illustrates the more uniform distribution of the value of the plasma expansion into a larger volume. The electron temperature when , however, peaks at the front edge of the plasma and its surrounding locality. The velocity of the Si IV ions is according to Fig. 6(d), which equates to kinetic energies approaching 1000 eV. The temperature of the boundary between the shock front and ambient Ar thus is dramatically increasing by collisions between fast ions and background gas. Although the plume core cools down at later time delay, the hot plume layer and Ar layer, which contain more energetic Si IV, Ar II, and even Si III ions, are continuously heated by the adjacent shock front layer and produce more electrons by thermionic ionization.
4. Conclusion
Laser ablation with incident wavelength of 532 nm onto a Si target at a variety of pressures is reported in this work. The evolution of the plume and the interaction between the plasma and ambient gas are investigated by analyzing individual emission images and line shapes from time-gated, spatially resolved measurements. The expansion of the plasma plume can be recorded at any given time delay from till a very late time when the plume totally cools down. The spatial evolution of the shock front produced by the plume–background gas collision agrees with the point blast model and indicates the progressive less hemispherical plume during the LIP expansion. The spatially and temporally resolved spectra from the optical emission and the further analysis offer an approach to better understanding of the interaction between the plume and ambient gas. The spatial distributions of the ions are found to associate with their ionization degree at the low pressure. The higher charged ions (e.g., Si IV) are accelerated to tens of km/s at the moderate pressure by the internal electric field gradient, which is established by fast expanding electrons formed at the early stage of the laser ablation and the spatial distribution of the various charge state ions. These robust ions collide with ambient Ar atoms at the front edge and generate the dense shock layer. As the background pressure increases, the Si IV emissions are partly vanished, while the plume is compressed, and more Si III and Ar II ions are freshly produced at the shock layer. An OES Stark broadening method based on spectral line analysis is applied to obtain the -dependent and values at and 70 ns. The distribution of becomes more uniform at a later time due to the spatial expansion. The results that the locally maximizes at the position of the shock front layer suggest the collisional process, which generates fresh electrons between the Si IV ions and ambient Ar atoms as the dominant mechanism of the plasma-gas interaction.
References
[1] N. Zhao, J. Li, Q. Ma, L. Guo, Q. Zhang. Periphery excitation of laser-induced CN fluorescence in plasma using laser-induced breakdown spectroscopy for carbon detection. Chin. Opt. Lett., 18, 083001(2020).
[2] X. Sun, D. Cui, Y. Hu, D. Chu, G. Chen, J. Yu, J. Zhou, J. A. Duan. Thermal process of silica glass microchannels fabricated by femtosecond laser ablation. Chin. Opt. Lett., 16, 101402(2018).
[3] X. Guo, J. Ding, Y. Zhou, Y. Wang. Ablation effects and mechanism of sintered silicon carbide ceramics by an ArF excimer laser. Chin. Opt. Lett., 16, 091402(2018).
[4] L. Jiao, B. S. Truscott, H. Liu, M. N. R. Ashfold, H. Ma. Imaging spectroscopy of polymer ablation plasmas for laser propulsion applications. J. Appl. Phys., 121, 013303(2017).
[5] M. N. R. Ashfold, F. Claeyssens, G. M. Fuge, S. J. Henley. Pulsed laser ablation and deposition of thin films. Chem. Soc. Rev., 33, 23(2004).
[6] H. Liu, M. N. R. Ashfold, D. N. Meehan, E. Wagenaars. Wavelength-dependent variations of the electron characteristics in laser-induced plasmas: a combined hydrodynamic and adiabatic expansion modelling and time-gated, optical emission imaging study. J. Appl. Phys., 125, 083304(2019).
[7] A. Bogaerts, Z. Chen, R. Gijbels, A. Vertes. Laser ablation for analytical sampling: what can we learn from modeling?. Spectrochim. Acta Part B, 58, 1867(2003).
[8] N. Farid, S. S. Harilal, H. Ding, A. Hassanein. Dynamics of ultrafast laser plasma expansion in the presence of an ambient. Appl. Phys. Lett., 103, 191112(2013).
[9] S. S. Harilal, C. V. Bindhu, M. S. Tillack, F. Najmabadi, A. C. Gaeris. Internal structure and expansion dynamics of laser ablation plumes into ambient gases. J. Appl. Phys., 93, 2380(2003).
[10] J. S. Cowpe, R. D. Pilkington, J. S. Astin, A. E. Hill. The effect of ambient pressure on laser-induced silicon plasma temperature, density and morphology. J. Phys. D, 42, 165202(2009).
[11] N. Farid, H. Wang, C. Li, X. Wu, H. Y. Oderji, H. Ding, G.-N. Luo. Effect of background gases at reduced pressures on the laser treated surface morphology, spectral emission and characteristics parameters of laser produced Mo plasmas. J. Nucl. Mater., 438, 183(2013).
[12] W. J. Keller, N. Shen, A. M. Rubenchik, S. Ly, R. Negres, R. N. Raman, J.-H. Yoo, G. Guss, J. S. Stolken, M. J. Matthews, J. D. Bude. Physics of picosecond pulse laser ablation. J. Appl. Phys., 125, 085103(2019).
[13] A. Delserieys, F. Y. Khattak, C. L. S. Lewis, D. Riley. Optical Thomson scatter from a laser-ablated magnesium plume. J. Appl. Phys., 106, 083304(2009).
[14] B. Doggett, C. Budtz-Joergensen, J. G. Lunney, P. Sheerin, M. M. Turner. Behaviour of a planar Langmuir probe in a laser ablation plasma. Appl. Surf. Sci., 247, 134(2005).
[15] M. Thiyagarajan, J. Scharer. Experimental investigation of ultraviolet laser induced plasma density and temperature evolution in air. J. Appl. Phys., 104, 013303(2008).
[16] K. Dzierże¸e¸ga, A. Mendys, B. Pokrzywka. What can we learn about laser-induced plasmas from Thomson scattering experiments. Spectrochim Acta Part B, 98, 76(2014).
[17] Z. Liu, G. Zhao, C. Guo, L. Chen, M. Chen, H. Liu, K. Han. Spatially and temporally resolved evaluation of local thermodynamic equilibrium for laser-induced plasma in a high vacuum. J. Anal. At. Spectrom., 36, 2362(2021).
[18] Y. B. Zel’dovich, Y. P. Raizer, W. D. Hayes, R. F. Probstein, S. P. Gill. Physics of Shock Waves and High Temperature Hydrodynamic Phenomena(1966).
[19] B. S. Truscott. An optical emission spectroscopic study of laser-induced Zn and ZnO plasma(2013).
[20] A. Kramida, Y. Ralchenko, J. Reader. NIST Atomic Spectra Database (Version 5.8)(2020).
[21] H. Liu, B. S. Truscott, M. N. R. Ashfold. Position- and time-resolved Stark broadening diagnostics of a non-thermal laser-induced plasma. Plasma Sources Sci. Technol., 25, 059501(2016).

Set citation alerts for the article
Please enter your email address
© Copyright 2018-2021 | Chinese Laser Press. All Rights Reserved 沪ICP备15018463号-20