• Advanced Photonics
  • Vol. 2, Issue 2, 026001 (2020)
Joowon Lim*, Ahmed B. Ayoub, and Demetri Psaltis
Author Affiliations
  • École Polytechnique Fédérale de Lausanne, Optics Laboratory, Lausanne, Switzerland
  • show less
    DOI: 10.1117/1.AP.2.2.026001 Cite this Article Set citation alerts
    Joowon Lim, Ahmed B. Ayoub, Demetri Psaltis. Three-dimensional tomography of red blood cells using deep learning[J]. Advanced Photonics, 2020, 2(2): 026001 Copy Citation Text show less
    The missing cone problem and overall scheme of the main idea. (a) Demonstration of the missing cone problem for a single RBC. The left two columns show the Rytov reconstruction and the right two columns show the ground truth. The first row displays the scattering potential, which can be converted to RI distributions, and the second row displays the k-spaces corresponding to the first row. (b) Overall scheme of the network.
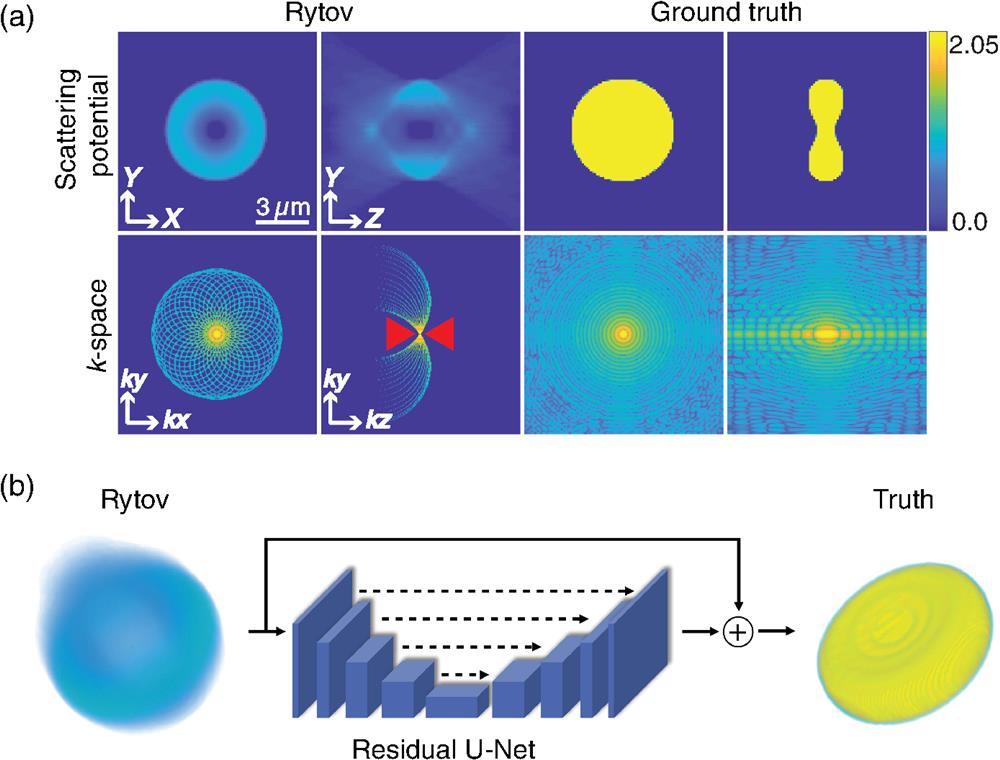
    Fig. 1. The missing cone problem and overall scheme of the main idea. (a) Demonstration of the missing cone problem for a single RBC. The left two columns show the Rytov reconstruction and the right two columns show the ground truth. The first row displays the scattering potential, which can be converted to RI distributions, and the second row displays the k-spaces corresponding to the first row. (b) Overall scheme of the network.
    Dataset generation. (a) RBC model parameters. (b) Synthetic measurements generation using the DDA. (c) Generation of synthetic measurements for two RBCs: one RBC lying in the xy plane and the same RBC but randomly rotated. The pairs of the Rytov reconstructions and the ground truth RBCs are presented. The scale represents the normalized RI, which is calculated by dividing the RI values of a sample by the RI of the background. (d) Schematic description of the z-shift variant property of the Rytov measurement.
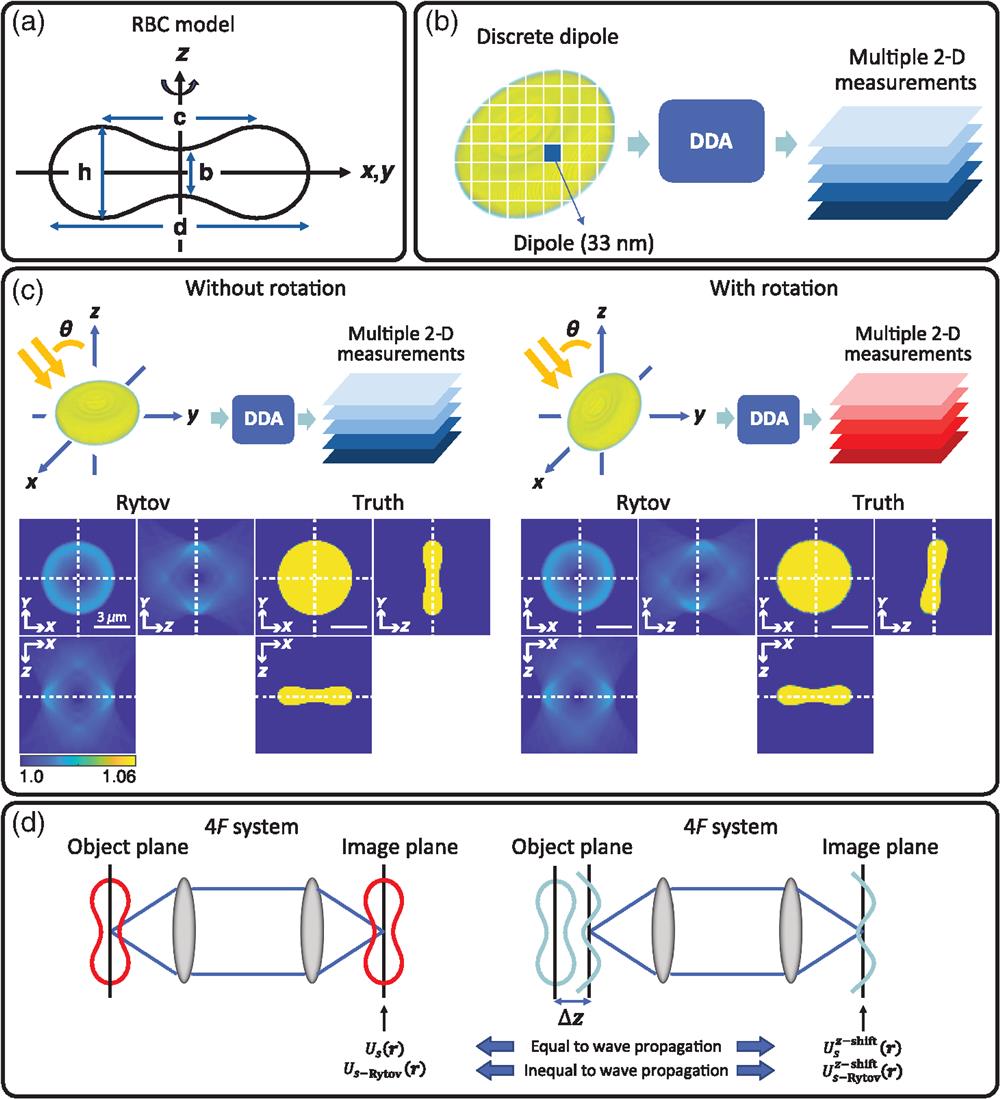
    Fig. 2. Dataset generation. (a) RBC model parameters. (b) Synthetic measurements generation using the DDA. (c) Generation of synthetic measurements for two RBCs: one RBC lying in the xy plane and the same RBC but randomly rotated. The pairs of the Rytov reconstructions and the ground truth RBCs are presented. The scale represents the normalized RI, which is calculated by dividing the RI values of a sample by the RI of the background. (d) Schematic description of the z-shift variant property of the Rytov measurement.
    Schematic description of the network structure. Here c represents the number of channels written at each block. WN, weight normalization; LRLU, leaky RELU; and LN, layer normalization.
    Fig. 3. Schematic description of the network structure. Here c represents the number of channels written at each block. WN, weight normalization; LRLU, leaky RELU; and LN, layer normalization.
    Schematic for the experimental setup. M, mirror; L, lens; OBJ, objective lens; and BS, beamsplitter.
    Fig. 4. Schematic for the experimental setup. M, mirror; L, lens; OBJ, objective lens; and BS, beamsplitter.
    Reconstruction results using two examples from the test datasets. (a) Results for an RBC without rotation and (b) results for another RBC with rotation. The scale represents the normalized RI, which is calculated by dividing the RI values of a sample with the RI of background.
    Fig. 5. Reconstruction results using two examples from the test datasets. (a) Results for an RBC without rotation and (b) results for another RBC with rotation. The scale represents the normalized RI, which is calculated by dividing the RI values of a sample with the RI of background.
    Reconstruction of mouse RBC from experimental data using the network trained on synthetic data. The images to the left show the Rytov reconstruction, which is the input to the network. The images to the right show the results of the TomoNet.
    Fig. 6. Reconstruction of mouse RBC from experimental data using the network trained on synthetic data. The images to the left show the Rytov reconstruction, which is the input to the network. The images to the right show the results of the TomoNet.
    Validation of the experimental result using semisynthetic measurements. (a) Overall scheme of semisynthetic measurement generation using DDA. (b) Phase difference maps for two randomly selected angles and the average maps for all angles. The color bars are in radians. Calculation of projection errors in retrieved phase information from experimental and semisynthetic measurements.
    Fig. 7. Validation of the experimental result using semisynthetic measurements. (a) Overall scheme of semisynthetic measurement generation using DDA. (b) Phase difference maps for two randomly selected angles and the average maps for all angles. The color bars are in radians. Calculation of projection errors in retrieved phase information from experimental and semisynthetic measurements.
    Joowon Lim, Ahmed B. Ayoub, Demetri Psaltis. Three-dimensional tomography of red blood cells using deep learning[J]. Advanced Photonics, 2020, 2(2): 026001
    Download Citation