• Infrared and Laser Engineering
  • Vol. 51, Issue 4, 20220171 (2022)
Shuai Yuan, Xiang Yan, Yugeng Zhang, and Hanlin Qin
Author Affiliations
  • School of Optoelectronic Engineering, Xidian University, Xi’an 710071, China
  • show less
    DOI: 10.3788/IRLA20220171 Cite this Article
    Shuai Yuan, Xiang Yan, Yugeng Zhang, Hanlin Qin. High-dynamic infrared small target detection based on double-neighborhood difference amplification method(Invited)[J]. Infrared and Laser Engineering, 2022, 51(4): 20220171 Copy Citation Text show less
    (a) Infrared image of the dark target and the local 3D gray image of the target; (b) Infrared image of the bright target and the local 3D gray image of the target
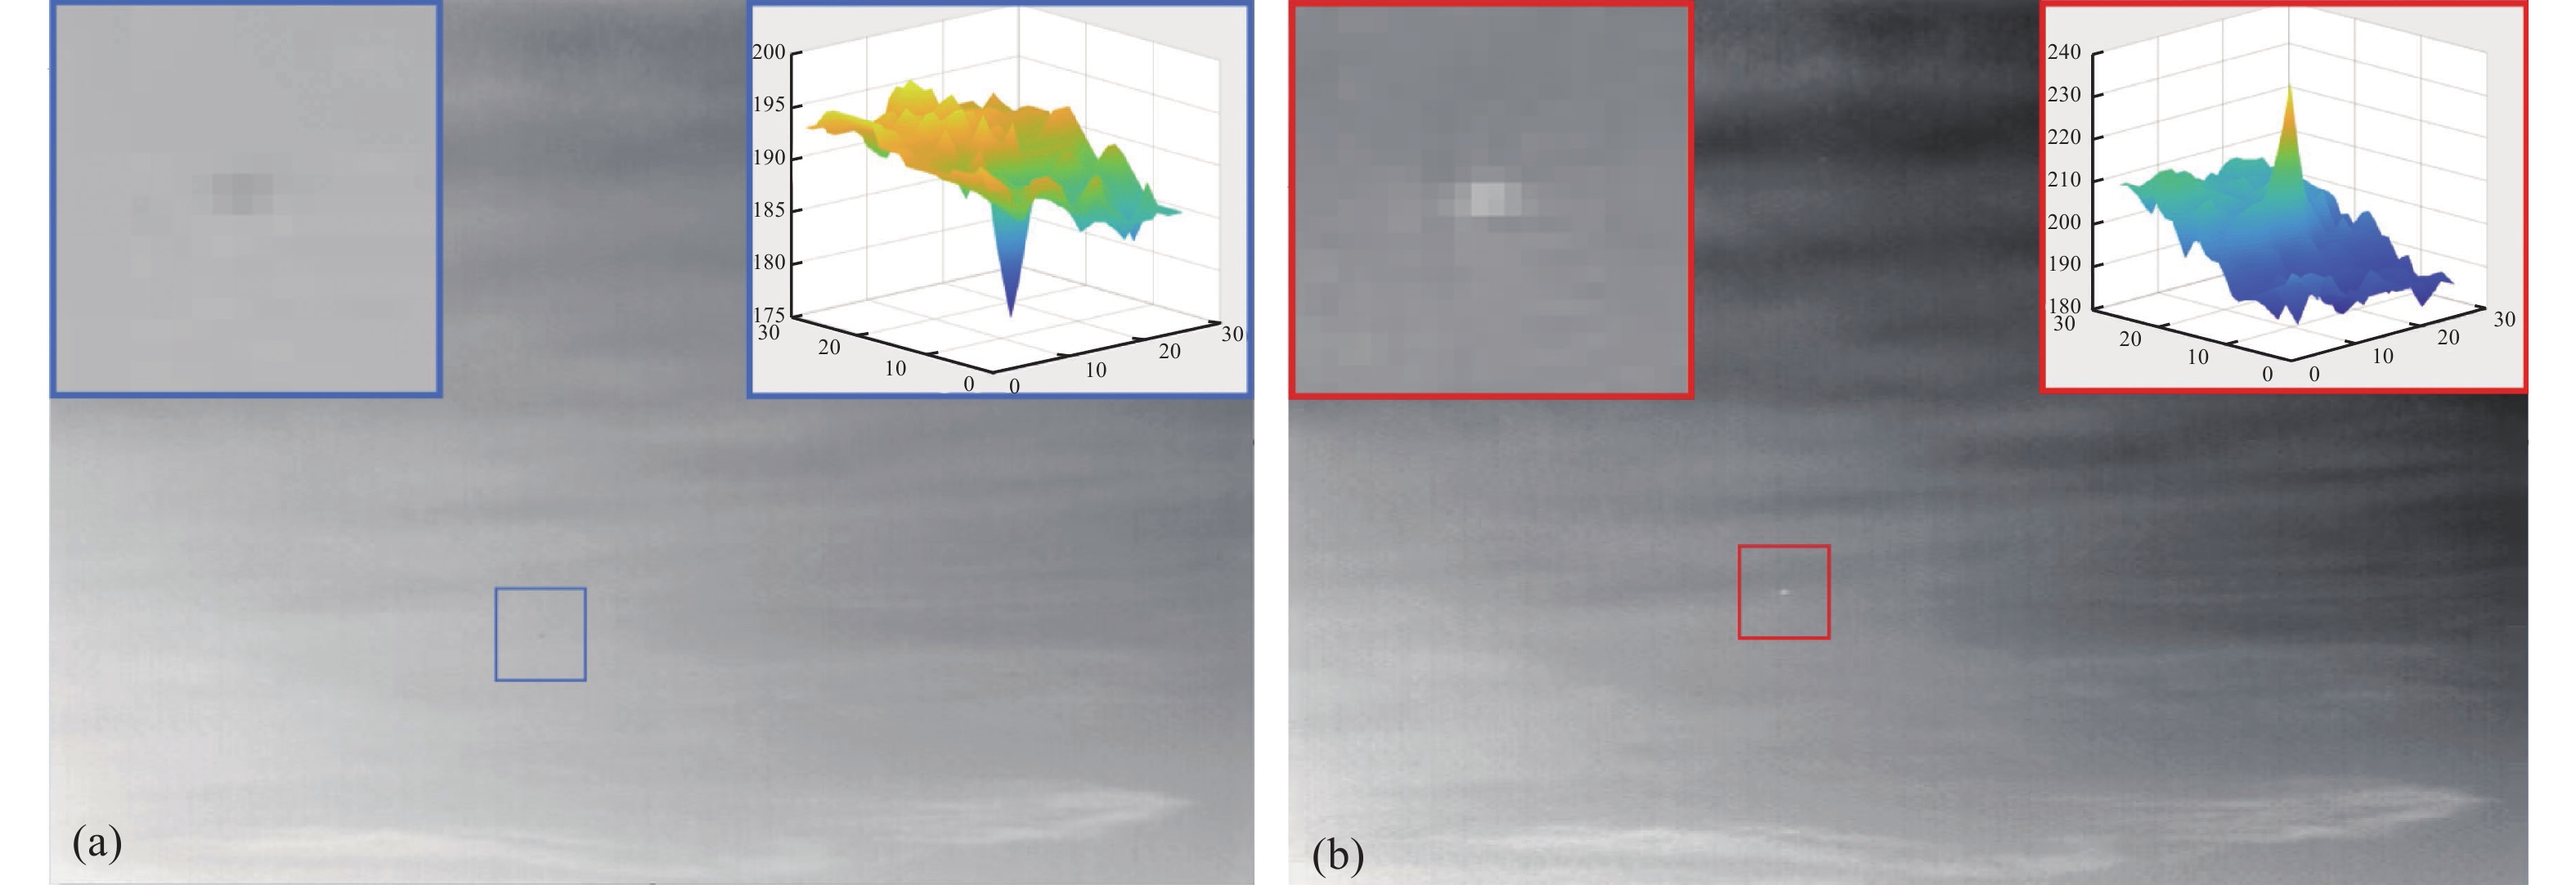
    Fig. 1. (a) Infrared image of the dark target and the local 3D gray image of the target; (b) Infrared image of the bright target and the local 3D gray image of the target
    (a) Working mode of sliding window and the division of multi-layer area; (b) A number of subwindows within a sliding window; (c) Schematic diagram of interpolation multiplication in four directions of the algorithm in this paper
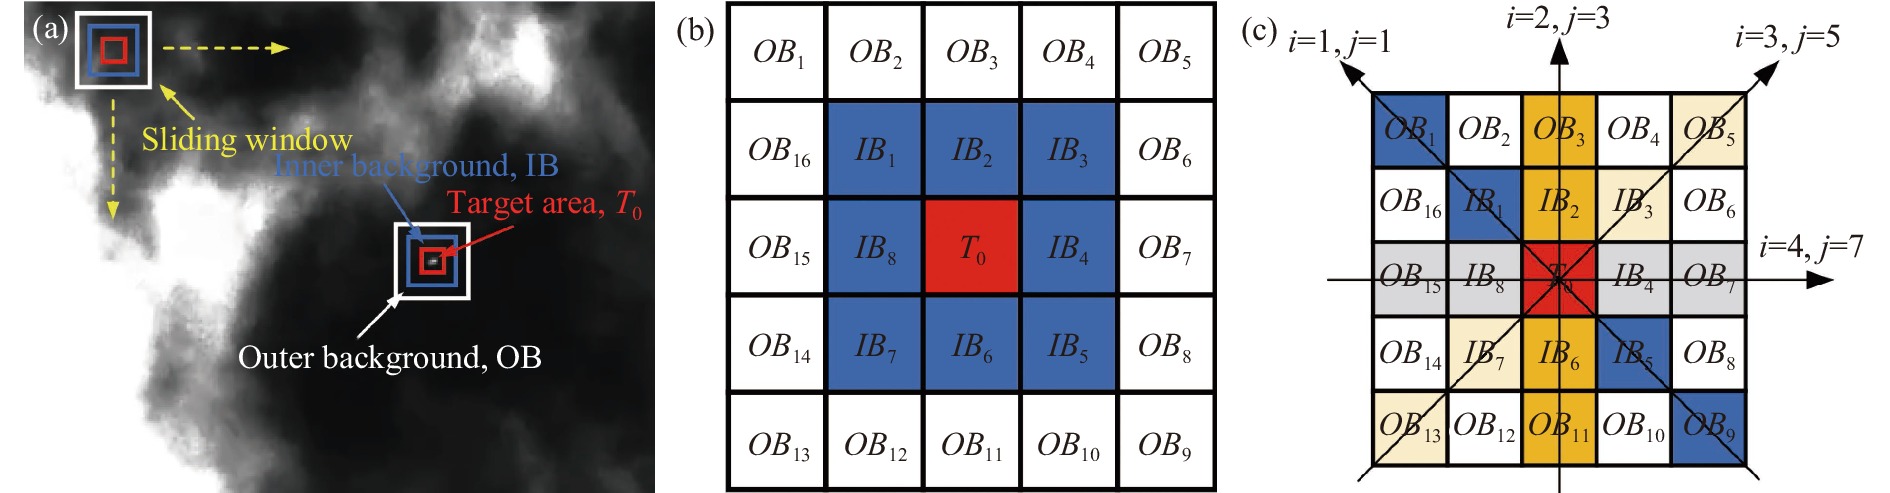
    Fig. 2. (a) Working mode of sliding window and the division of multi-layer area; (b) A number of subwindows within a sliding window; (c) Schematic diagram of interpolation multiplication in four directions of the algorithm in this paper
    (a) Small size target detection; (b) Large size target detection
    Fig. 3. (a) Small size target detection; (b) Large size target detection
    Detection result of multi-scale bright and dark target by DDAM
    Fig. 4. Detection result of multi-scale bright and dark target by DDAM
    Flow chart of small object detection
    Fig. 5. Flow chart of small object detection
    Detection results of nine algorithms for three groups of real infrared sequences
    Fig. 6. Detection results of nine algorithms for three groups of real infrared sequences
    TTSM construction diagram
    Fig. 7. TTSM construction diagram
    Nine algorithms for TTSM of three sets of real infrared sequences
    Fig. 8. Nine algorithms for TTSM of three sets of real infrared sequences
    ROC curves of nine algorithms under three different scenes
    Fig. 9. ROC curves of nine algorithms under three different scenes
    Detection results of DDAM in nine consecutive frames of complex scenes
    Fig. 10. Detection results of DDAM in nine consecutive frames of complex scenes
    SequencesImage resolutionImage numberTarget sizeTarget brightnessScenes description
    1400×560502×3-4×6Dark and brightComplex background interference
    2420×560903×4-6×9BrightStrong noise interference
    3512×6401156×9-9×9BrightStrong edge interference
    Table 1. Three groups of test data parameters
    Evaluation indicatorsSequencesTop-hatLCMMPCMRLCMTTLCMADMDDNGMDLCMDDAM
    $ \overline{\mathrm{S}\mathrm{C}\mathrm{R}\mathrm{G}} $110.564NaN45.296NaNNaN83.915305.688 NInf=1369.42 NInf=5342.158 NInf=6
    25.3522.2258.0162.4537.9158.991159.462 NInf=38169.824 NInf=40286.574NInf=38
    31.9390.53011.7580.90813.27814.809138.146 NInf=2663.864 NInf=3562.391 NInf=37
    $ \overline{\mathrm{B}\mathrm{S}\mathrm{F}} $11.2060.767 NInf=34.4270.721 NInf=14.394 NInf=413.60146.914 NInf=155.782 NInf=554.69 NInf=6
    21.3900.3583.2320.4372.2504.80673.152 NInf=3880.489 NInf=40135.201NInf=38
    31.3840.4456.2444.0556.15410.188107.484 NInf=2673.264 NInf=3583.793 NInf=37
    Time/s10.0190.1210.1356.3284.1010.0340.1620.1520.120
    20.0150.1140.1305.6133.5710.0310.1580.1480.113
    30.0150.1630.1927.6204.7990.0360.2270.2150.170
    Table 2. \begin{document}$ \overline{\mathrm{S}\mathrm{C}\mathrm{R}\mathrm{G}} $\end{document}, \begin{document}$ \overline{\mathrm{B}\mathrm{S}\mathrm{F}} $\end{document} and real time performance of nine algorithms in three groups of scenarios
    SequencesTPRTop-hatLCMMPCMRLCMTTLCMADMDDNGMDLCMDDAM
    1Pd-40.720NaN0.920NaNNaN0.7200.7400.7400.960
    Pd-30.760NaN0.960NaNNaN0.7400.7800.7800.960
    Pd-20.8200.4800.9600.7800.7600.7800.7800.7800.980
    2Pd-40.900NaN0.811NaN0.8440.7280.9440.9670.900
    Pd-30.9560.6780.8440.8110.9220.8220.9670.9670.989
    Pd-20.9780.8640.9660.9560.9890.9780.9780.9730.991
    3Pd-40.2380.1030.276NaN0.3530.0360.4130.2010.370
    Pd-30.3700.1810.7850.3880.9740.9310.9820.9820.982
    Pd-20.9820.3710.9820.4740.9820.9820.9820.9820.982
    Table 3. Detection accuracy of nine algorithms in three groups of stypical cenarios
    AlgorithmsTop-hatLCMMPCMRLCMTTLCMADMDDNGMDLCMDDAM
    $ \overline{\mathrm{S}\mathrm{C}\mathrm{R}\mathrm{G}} $6.2516.10620.9762.4739.11237.572205.098205.036230.499
    $ \overline{\mathrm{B}\mathrm{S}\mathrm{F}} $1.4710.5274.9772.7384.27910.13876.39869.89593.388
    Time/s0.0160.1350.1576.5234.2180.0380.1840.1730.139
    TPR Pd-40.6090.4670.6730.4990.5720.5230.7030.6290.747
    TPR Pd-30.6670.5120.8630.6530.8920.8280.9050.9090.933
    TPR Pd-20.9100.6460.9250.7490.9230.9130.9260.9120.949
    Table 4. Average performance comparison of several target detection algorithms on twelve scences
    Shuai Yuan, Xiang Yan, Yugeng Zhang, Hanlin Qin. High-dynamic infrared small target detection based on double-neighborhood difference amplification method(Invited)[J]. Infrared and Laser Engineering, 2022, 51(4): 20220171
    Download Citation