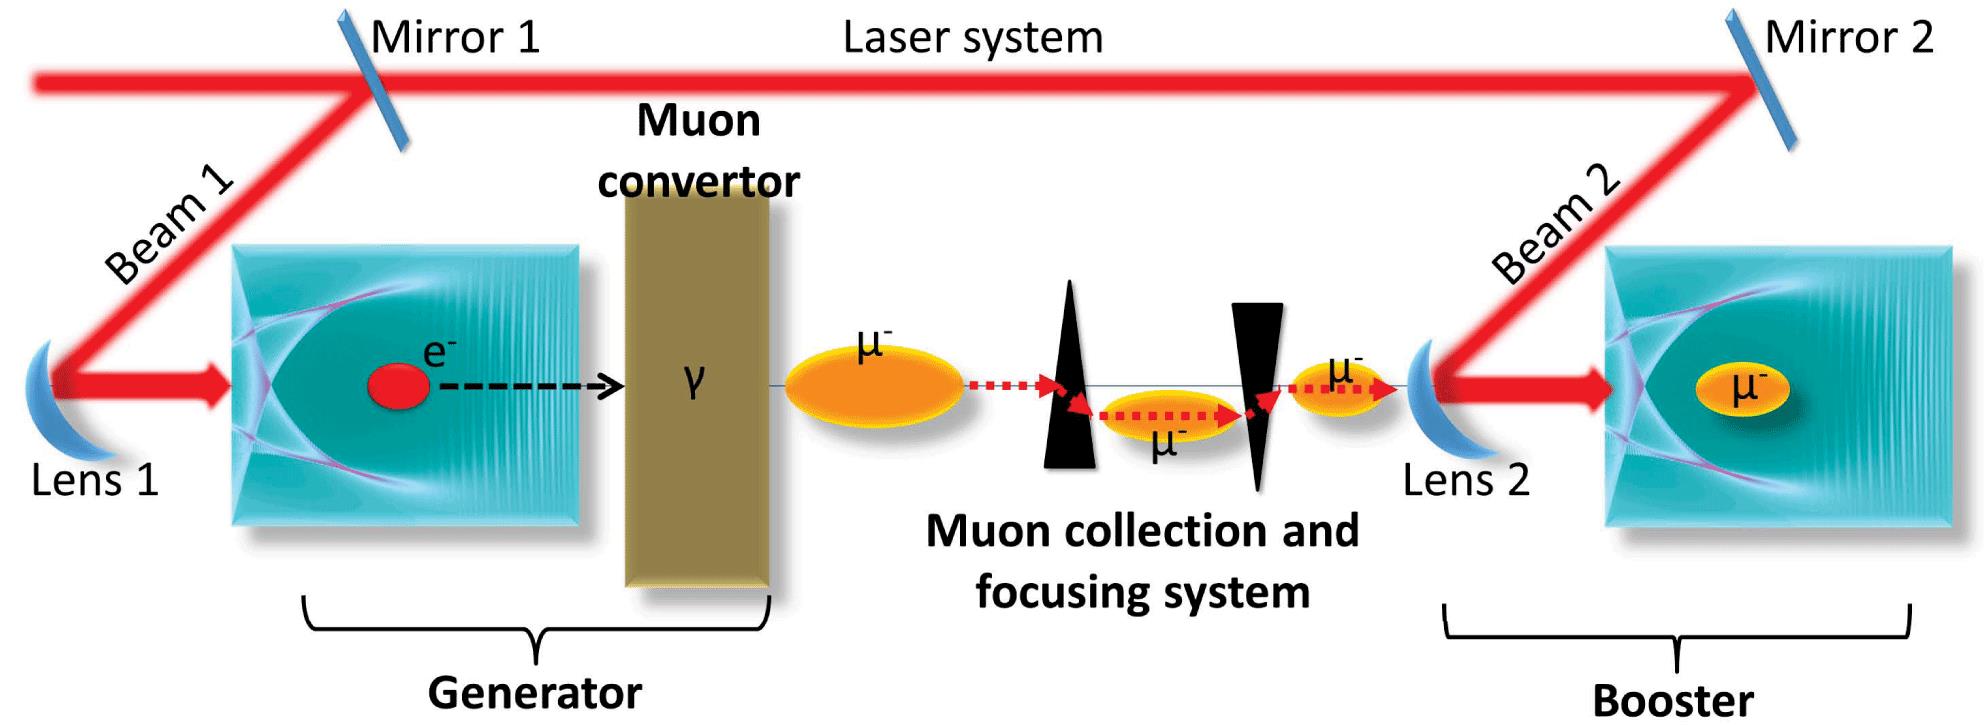
 materials. After a proper collection and focusing system, muons are boosted by another laser wakefield, the ‘Booster’.
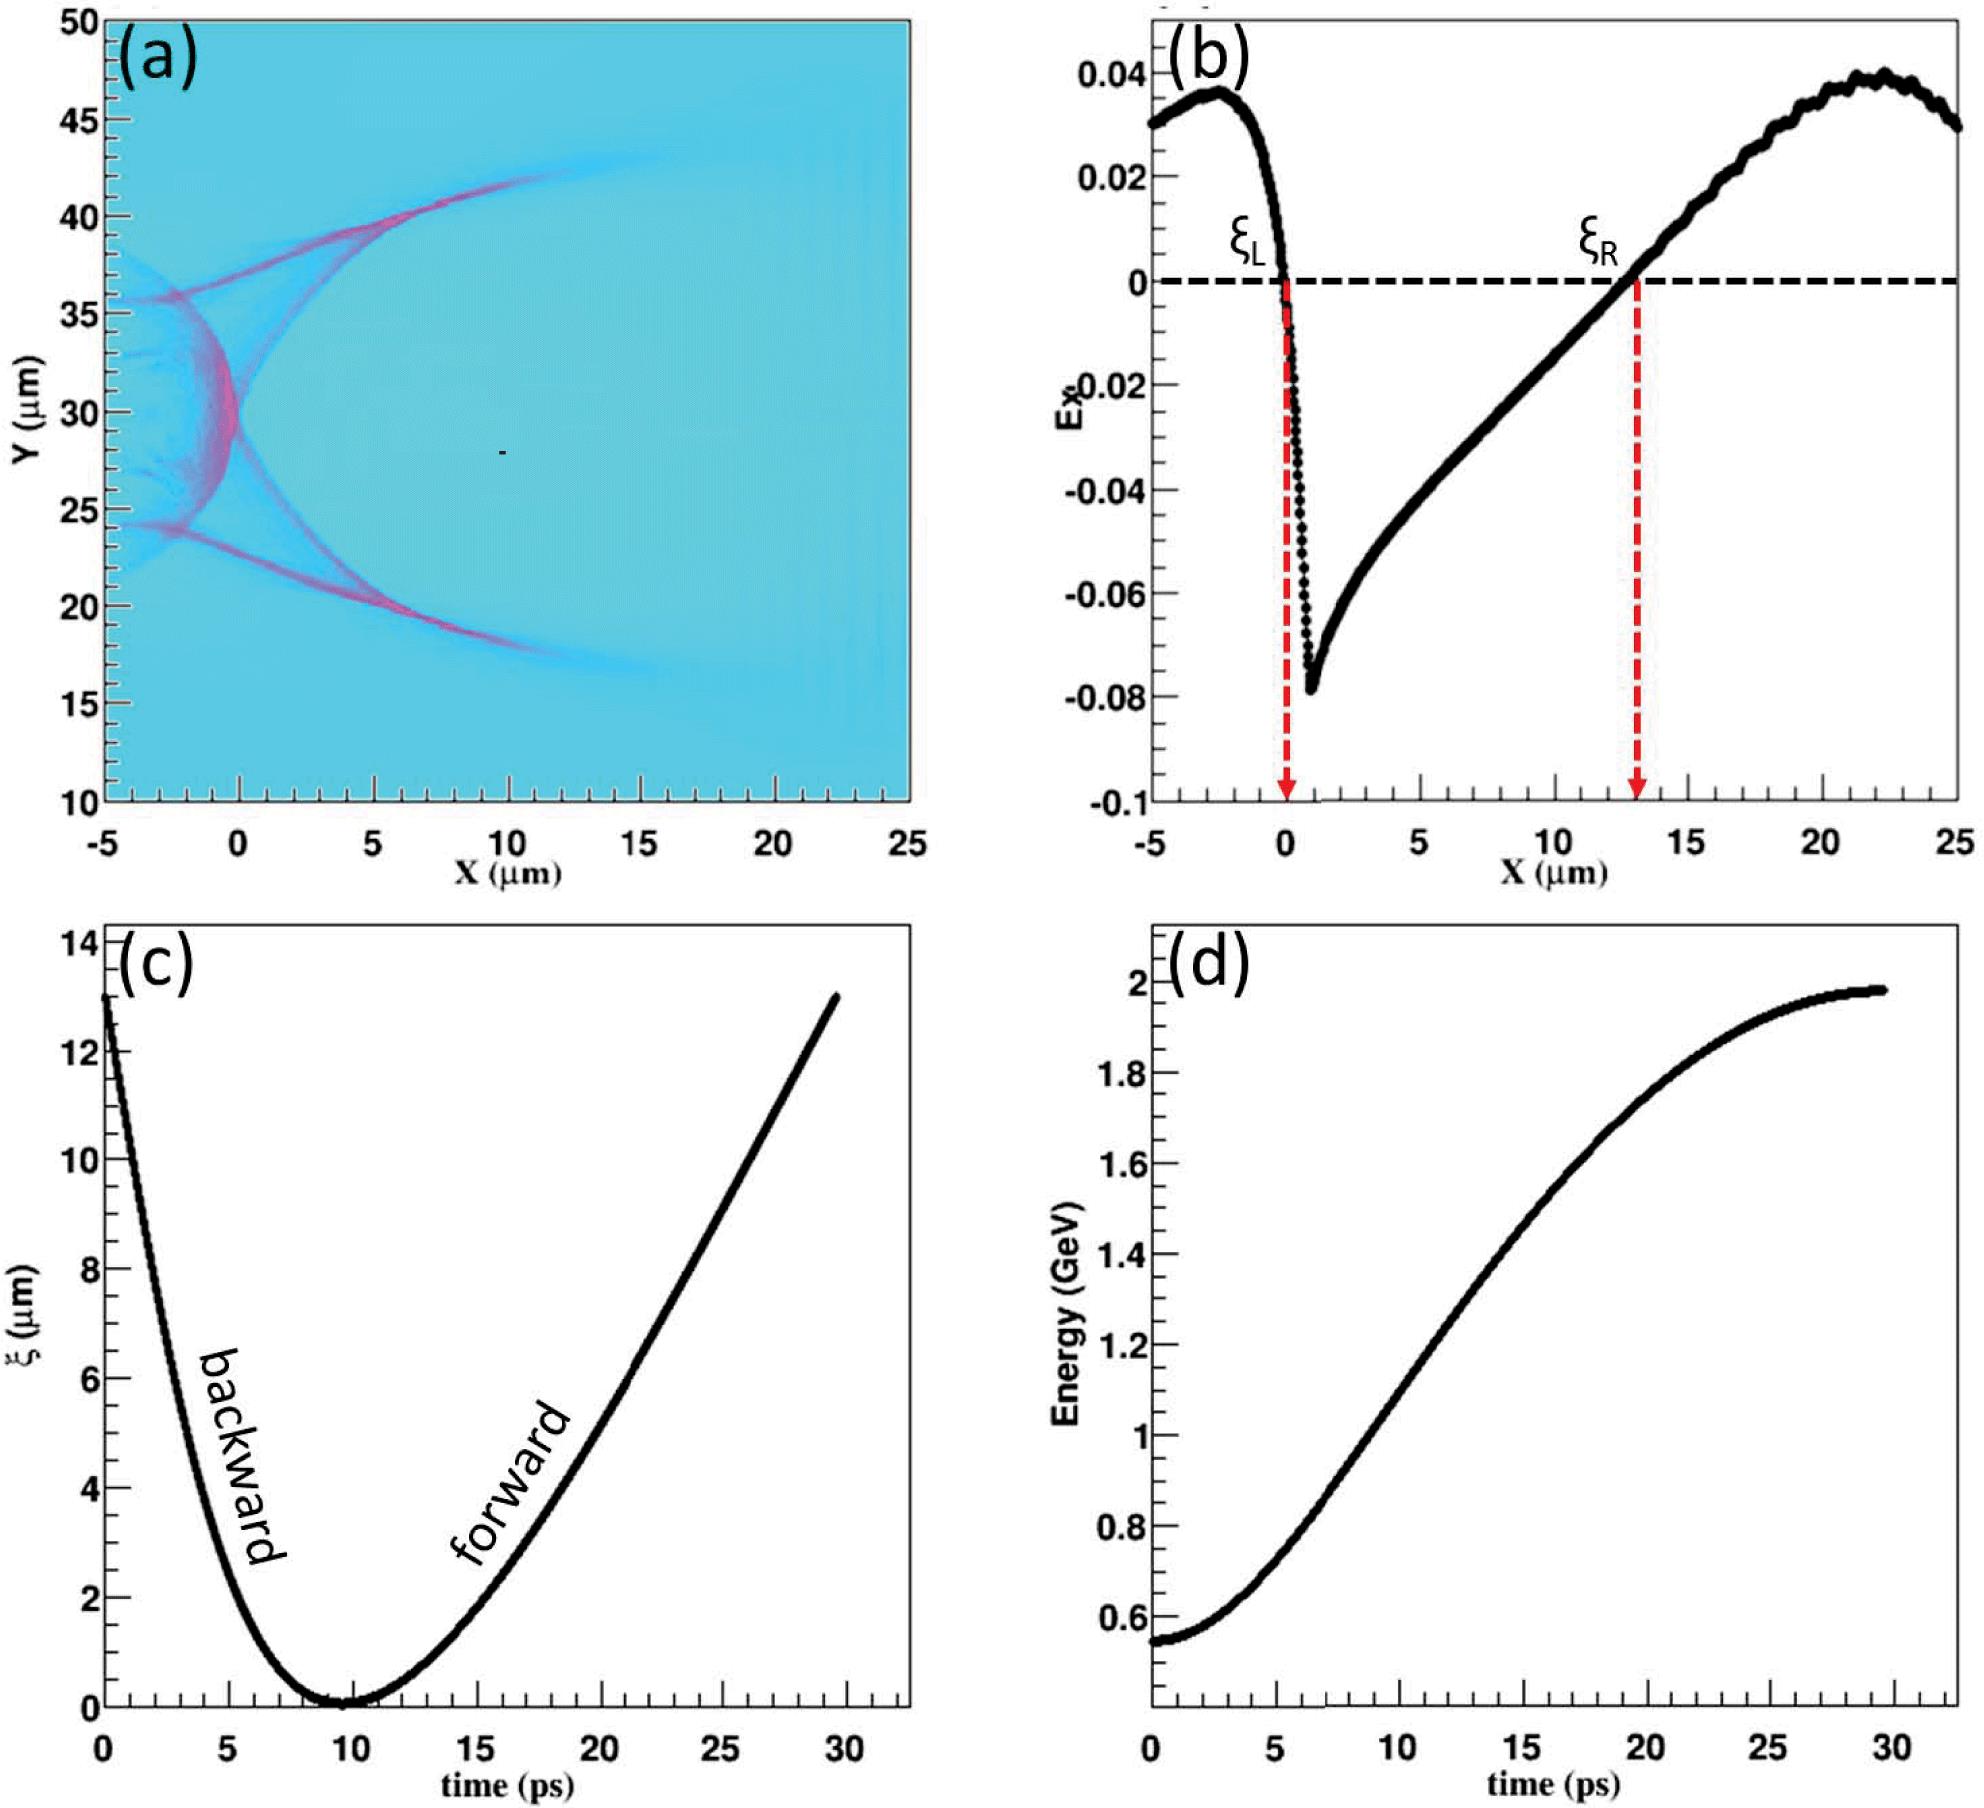
 . The laser pulse of wavelength
 , normalized peak amplitude
 , pulse duration 33 fs and FWHM spot size
 entered from the left of the simulation box in the
 direction. A muon with critical trapping energy entered into the simulation box following the trajectory shown in (c) and the energy increasing process in (d).
  depending on the initial energy
 with different positions in the rest frame of bubble
 from the one-dimensional analytical model denoted by the solid lines. Clearly trapping energy thresholds presented from the sharp peaks of the lines. The two-dimensional PIC simulations of the forward (red dots) and backward (blue dots) muons at
 show well agreement with the one-dimensional estimation. (b) The inner plot shows the spectra of the forward (red lines) and backward (blue lines) muons, where dashed lines denote the initialized energy spectra and the solid lines denote the acceleration energy spectra at
 .
.  ps, (b) 1.65 ps, (c) 16.5 ps and (d) 33 ps. (e)–(h) The
 and (i)–(l)
 phase spaces of forward (red dots) and backward (blue dots) muons at the four snapshots are also shown, respectively.
  and (b) the relevant trapping energy threshold
 from the one-dimensional analytic model. The extrapolation of electrons (open circles) in the same parameters is also shown for comparison.
F. Zhang, Z. G. Deng, L. Q. Shan, Z. M. Zhang, B. Bi, D. X. Liu, W. W. Wang, Z. Q. Yuan, C. Tian, S. Q. Yang, B. Zhang, Y. Q. Gu. All-optical
 acceleration in the laser wakefield[J]. High Power Laser Science and Engineering, 2018, 6(4): 04000e63
 acceleration in the laser wakefield[J]. High Power Laser Science and Engineering, 2018, 6(4): 04000e63