
Yan Liang, Qilai Fei, Zhihe Liu, Kun Huang, Heping Zeng, "Low-noise InGaAs/InP single-photon detector with widely tunable repetition rates," Photonics Res. 7, A1 (2019)
- Photonics Research
- Vol. 7, Issue 3, A1 (2019)
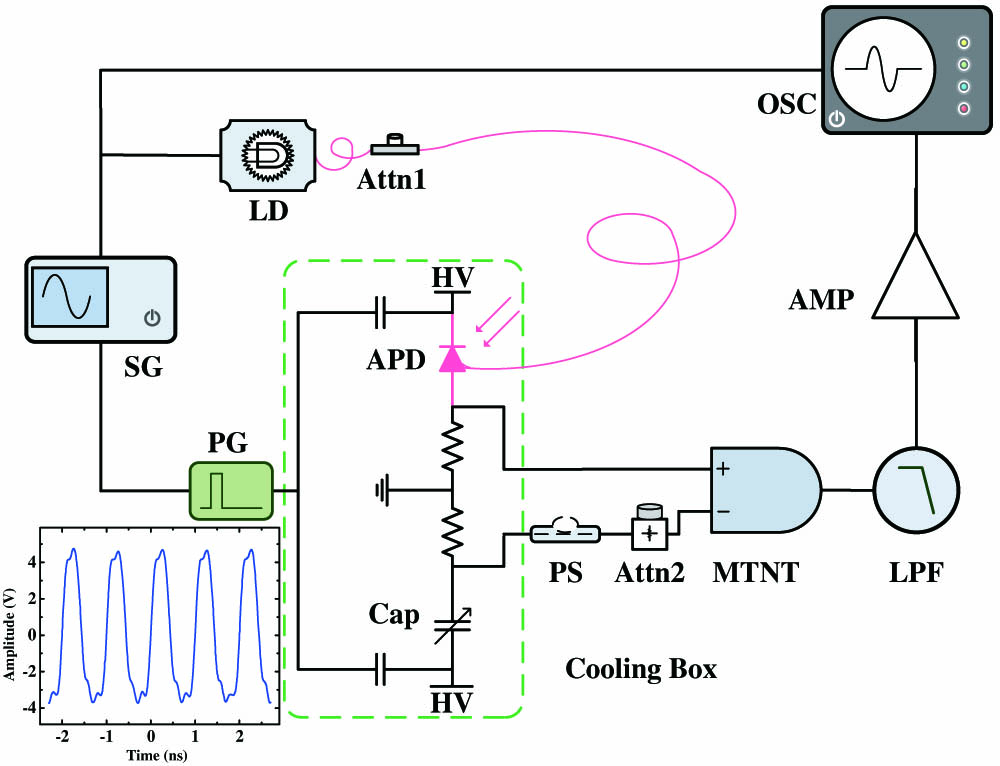
Fig. 1. Schematic setup of the InGaAs/InP SPD with ultrashort gates. SG, signal generator; LD, laser diode; Attn1, variable optical attenuator; PG, pulse-generating module; Cap, adjustable capacitor; PS, phase shifter; Attn2, variable electric attenuator; MTNT, so-called magic-T network consisting of a broadband transformer; LPF, low-pass filter; AMP: RF amplifier; OSC, oscilloscope. Inset, waveform of 1-GHz signal output of the PG.
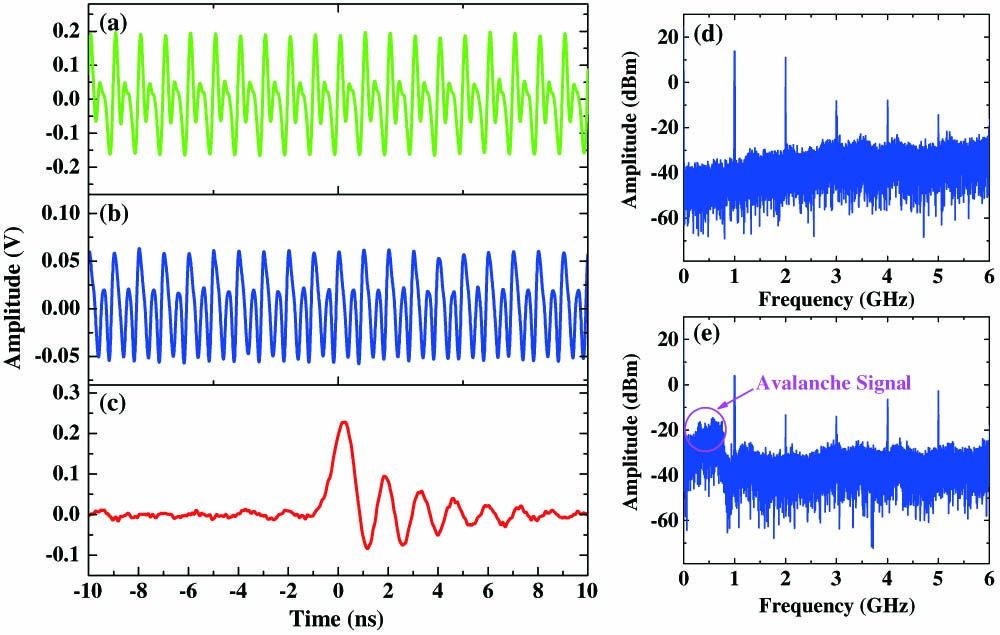
Fig. 2. (a)–(c) Oscilloscope trace of the output of the APD, the MTNT, and the RF amplifier, respectively; (d) and (e) frequency spectrum of the output of the MTNT and the RF amplifier, respectively.
Fig. 3. (a) Waveforms of the amplified output signal of the MTNT and LPF at 100 MHz captured by the oscilloscope in the single mode; (b) DCR and AP as functions of DE of the SPD at 100 MHz.
Fig. 4. (a) Waveforms of the amplified output signal of the MTNT and LPF at 700 MHz captured by the oscilloscope in the single mode; (b) DCR and AP as functions of DE of the SPD at 700 MHz.
Fig. 5. (a) and (b) DCR and AP as functions of DE of the SPD at 1 and 1.25 GHz; (c) count rate dependent on the laser pulse delay.
| ||||||||||||||||||||||||||||||
Table 1. Performance of the SPD at Different Repetition Frequencies


Set citation alerts for the article
Please enter your email address

© Copyright 2018-2021 | Chinese Laser Press. All Rights Reserved 沪ICP备15018463号-20