• Chinese Optics Letters
  • Vol. 14, Issue 12, 121102 (2016)
Hao Yang1、*, Baosheng Zhao2, Qiurong Yan3, and Yong’an Liu2
Author Affiliations
  • 1Shaanxi Key Laboratory of Optical Information Technology, School of Science, Northwestern Polytechnical University, Xi’an 710072, China
  • 2State Key Laboratory of Transient Optics and Photonics, Xi’an Institute of Optics and Precision Mechanics, Chinese Academy of Sciences, Xi’an 710119, China
  • 3Department of Electronic Information Engineering, Nanchang University, Nanchang 330031, China
  • show less
    DOI: 10.3788/COL201614.121102 Cite this Article Set citation alerts
    Hao Yang, Baosheng Zhao, Qiurong Yan, Yong’an Liu. Modeling the encoding structure and spatial resolution of photon counting imagers with Vernier anode readout[J]. Chinese Optics Letters, 2016, 14(12): 121102 Copy Citation Text show less
    Sketch of the Vernier anode-based imaging system showing the distribution noise of the charge cloud, electronic noise, and quantized noise of the data acquisition subsystem.
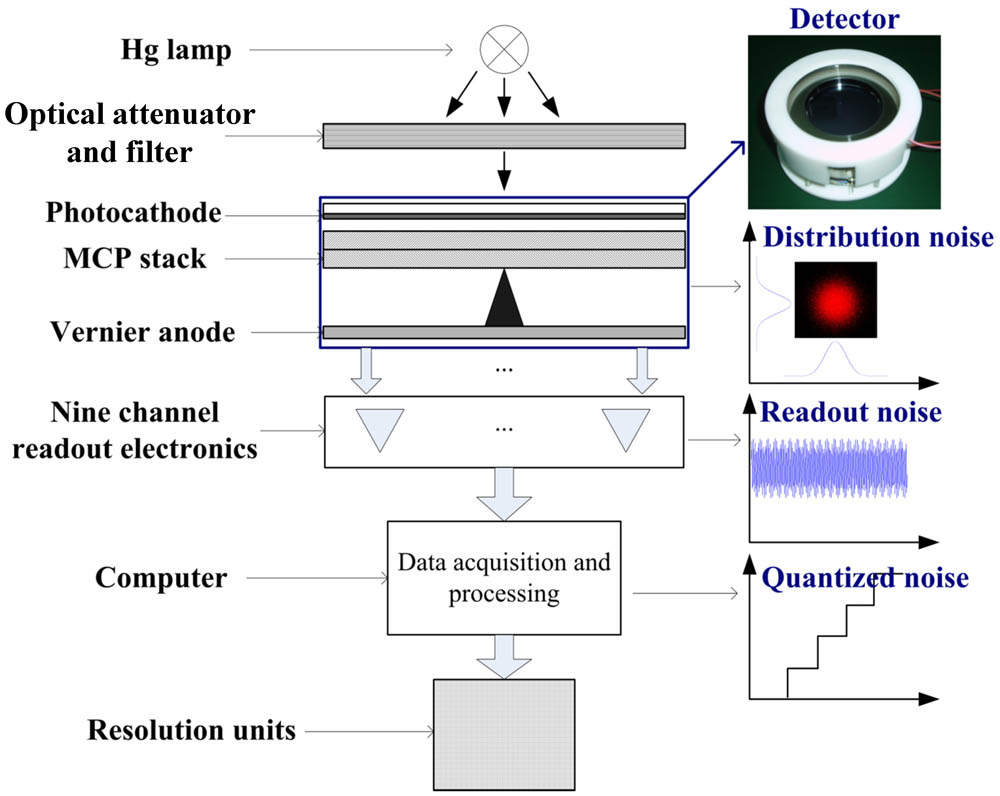
    Fig. 1. Sketch of the Vernier anode-based imaging system showing the distribution noise of the charge cloud, electronic noise, and quantized noise of the data acquisition subsystem.
    (a) Schematic encoding structure of the Vernier anode covered by the charge cloud showing only 4 pitches, (b) an image of a practical two-dimensional Vernier anode with 1.2 mm pitch fabricated by laser etching, (c) the geometrical relationship between the charge cloud and the anode encoding structure within the charge cloud region; the periodic length of the sinusoidal isolating channel is much greater than the radius of the charge cloud so that the width variation of the electrode is approximately linear within the charge cloud area.
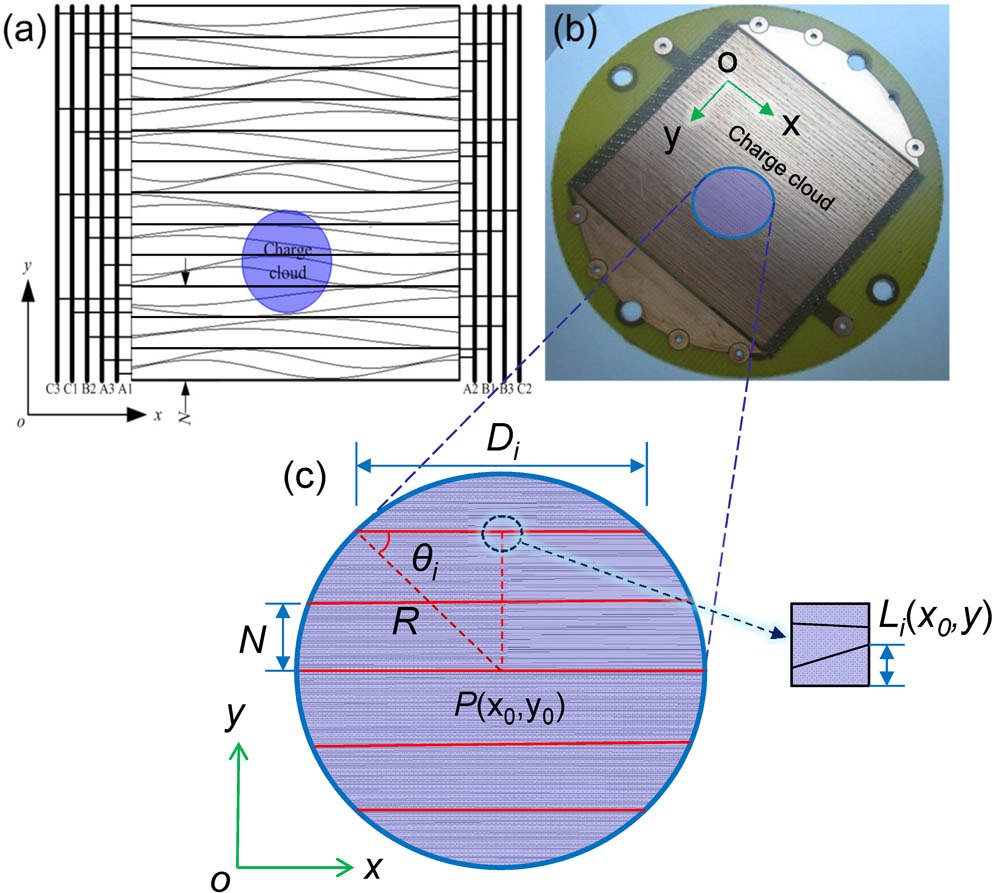
    Fig. 2. (a) Schematic encoding structure of the Vernier anode covered by the charge cloud showing only 4 pitches, (b) an image of a practical two-dimensional Vernier anode with 1.2 mm pitch fabricated by laser etching, (c) the geometrical relationship between the charge cloud and the anode encoding structure within the charge cloud region; the periodic length of the sinusoidal isolating channel is much greater than the radius of the charge cloud so that the width variation of the electrode is approximately linear within the charge cloud area.
    The limiting resolution calculation results with a readout electronics gain of 31.6 dB, an MCP electron gain of 106, a feedback capacitor of the charge sensitive preamplifiers of 1 pF, a reference voltage of the data acquisition system of 1 V, a bit width of the ADCs of 12, an anode size of 30 mm, and a coarse pixel number of 4; (a) as a function of the pitch width N and the charge cloud radius R, (b) as a function of the phase coordinate with k=4.9×1014 mm2/C, R=5 mm and N=1.2 mm.
    Fig. 3. The limiting resolution calculation results with a readout electronics gain of 31.6 dB, an MCP electron gain of 106, a feedback capacitor of the charge sensitive preamplifiers of 1 pF, a reference voltage of the data acquisition system of 1 V, a bit width of the ADCs of 12, an anode size of 30 mm, and a coarse pixel number of 4; (a) as a function of the pitch width N and the charge cloud radius R, (b) as a function of the phase coordinate with k=4.9×1014mm2/C, R=5mm and N=1.2mm.
    (a) Relationships between the spatial resolution (FWHM) and the ENC of the detector by noise and resolution calculations during the decoding process for different encoding patterns within a low noise range, with L=30 mm, A=17.5 dB, cf=1 pF, and Q=8×10⁻¹³ C; (b) the imaging result for m=2 by appending Gaussian noise with an electrode noise level of 1 mV rms to the simulation data matrix with a lattice spacing of 100 μm using the parameters configured in (a), inset: a normal probability plot of the appended noise data using MATLAB 7.0, which indicates a normal distribution of noise data if a linear relation is exhibited; (c) the detector noise estimation of ∼2 mV (Vp-p rms) by signal acquisition with an oscilloscope from the electrode output port of the detector, and (d) the experimental imaging result with as patial resolution of ∼75 μm with L=30 mm, N=1.2 mm, A=17.5 dB, cf=1 pF, G=5×10⁶, and m=2 under the noise level in (c) using a mask of USAF-1951.
    Fig. 4. (a) Relationships between the spatial resolution (FWHM) and the ENC of the detector by noise and resolution calculations during the decoding process for different encoding patterns within a low noise range, with L=30mm, A=17.5dB, cf=1pF, and Q=8×10¹³C; (b) the imaging result for m=2 by appending Gaussian noise with an electrode noise level of 1 mV rms to the simulation data matrix with a lattice spacing of 100 μm using the parameters configured in (a), inset: a normal probability plot of the appended noise data using MATLAB 7.0, which indicates a normal distribution of noise data if a linear relation is exhibited; (c) the detector noise estimation of 2mV (Vp-p rms) by signal acquisition with an oscilloscope from the electrode output port of the detector, and (d) the experimental imaging result with as patial resolution of 75μm with L=30mm, N=1.2mm, A=17.5dB, cf=1pF, G=5×10⁶, and m=2 under the noise level in (c) using a mask of USAF-1951.
    Hao Yang, Baosheng Zhao, Qiurong Yan, Yong’an Liu. Modeling the encoding structure and spatial resolution of photon counting imagers with Vernier anode readout[J]. Chinese Optics Letters, 2016, 14(12): 121102
    Download Citation