• Spectroscopy and Spectral Analysis
  • Vol. 42, Issue 9, 2800 (2022)
Zi-yun HONG1、*, Cheng-lin YAN2、2;, Hong MIN2、2;, Yan-jun XING1、1; *;, Chen LI2、2;, and Shu LIU2、2; *;
Author Affiliations
  • 11. Chemical Engineering and Biotechnology, Key Laboratory of Science and Technology of Eco-Textile, Ministry of Education, Donghua University, Shanghai 201620, China
  • 22. Technical Center for Industrial Product and Raw Material Inspection and Testing, Shanghai Customs, Shanghai 200135, China
  • show less
    DOI: 10.3964/j.issn.1000-0593(2022)09-2800-07 Cite this Article
    Zi-yun HONG, Cheng-lin YAN, Hong MIN, Yan-jun XING, Chen LI, Shu LIU. Research on Coal Species Identification Based on Near-Infrared Spectroscopy and Discriminant Analysis[J]. Spectroscopy and Spectral Analysis, 2022, 42(9): 2800 Copy Citation Text show less
    Near-infrared spectra of different coals
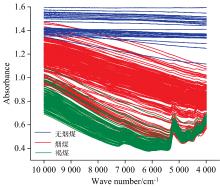
    Fig. 1. Near-infrared spectra of different coals
    (a) The near-infrared spectroscopy of lignite (YNH, FH), bituminous coal (AY, MY) and anthracite (EWY, CWY); (b) The relationship between the absorbance at 10 001 cm-1 and the fixed carbon content
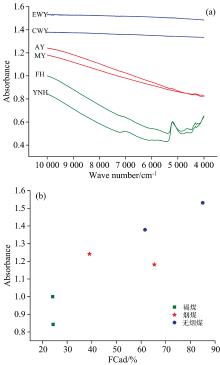
    Fig. 2. (a) The near-infrared spectroscopy of lignite (YNH, FH), bituminous coal (AY, MY) and anthracite (EWY, CWY); (b) The relationship between the absorbance at 10 001 cm-1 and the fixed carbon content
    (a) The XRD spectra of lignite (YNH, FH), bituminous coal (AY, MY) and anthracite (EWY, CWY); (b) Gaussian fitting curve of γ peak and 002 peak of EWY coal sample in 2θ range of 10°~35°
    Fig. 3. (a) The XRD spectra of lignite (YNH, FH), bituminous coal (AY, MY) and anthracite (EWY, CWY); (b) Gaussian fitting curve of γ peak and 002 peak of EWY coal sample in 2θ range of 10°~35°
    (a) The relationship between the fa and the H/C; (b) The relationship between the spectral slope and the fa
    Fig. 4. (a) The relationship between the fa and the H/C; (b) The relationship between the spectral slope and the fa
    (a) Cumulative contribution rate of PCs; Loading plot of (b) PC1 (98.11%), (c) PC2 (1.708%)
    Fig. 5. (a) Cumulative contribution rate of PCs; Loading plot of (b) PC1 (98.11%), (c) PC2 (1.708%)
    (a) Discriminant function (F1, F2) decentralized point map; (b) Correlation coefficient of each variable in the discriminant function (F1, F2)
    Fig. 6. (a) Discriminant function (F1, F2) decentralized point map; (b) Correlation coefficient of each variable in the discriminant function (F1, F2)
    煤种国别样品数建模集测试集总计
    烟煤俄罗斯7217374247
    澳大利亚95
    印度尼西亚29
    蒙古30
    加拿大15
    哈萨克斯坦6
    褐煤印度尼西亚1269440134
    菲律宾8
    无烟煤俄罗斯1521829
    越南9
    朝鲜5
    Table 1. Summary of the number of experimental samples
    近似分析
    (db, Wt%)
    最终分析
    (daf, Wt%)
    H/C
    水分挥发分固定碳CH
    YNH19.3538.2824.3467.123.190.570
    FH10.1235.2724.1461.373.940.770
    AY6.9423.6939.0762.452.890.555
    MY1.1514.5665.3675.453.560.566
    EWY6.072.7184.9976.183.330.525
    CWY2.775.3861.6082.453.190.464
    Table 2. Proximate analyse and ultimate analyses of lignite (YNH, FH), bituminous coal (AY, MY) and anthracite (EWY, CWY)
    样品γ002峰fa
    峰位峰面积半峰
    全宽
    峰位峰面积半峰
    全宽
    YNH18.335 150.669.5224.045 116.697.580.498
    FH19.167 480.888.6624.712 672.725.90.263
    AY21.583 524.845.9225.736 763.854.240.657
    MY20.281 056.223.9325.018 302.364.680.887
    EWY19.381 102.794.7325.5610 095.724.730.902
    CWY19.571 923.675.1725.8618 423.645.170.905
    Table 3. Structure parameters of XRD
    建模样品集交叉验证测试样品集
    烟煤98.397.797.3
    褐煤95.795.7100
    无烟煤100100100
    9897.899.1
    Table 4. Discrimination accuracy (%)
    Zi-yun HONG, Cheng-lin YAN, Hong MIN, Yan-jun XING, Chen LI, Shu LIU. Research on Coal Species Identification Based on Near-Infrared Spectroscopy and Discriminant Analysis[J]. Spectroscopy and Spectral Analysis, 2022, 42(9): 2800
    Download Citation