• Advanced Photonics
  • Vol. 3, Issue 2, 025001 (2021)
Zhihao Zhou1, Wei Liu2, Jiajing He1, Lei Chen2, Xin Luo1, Dongyi Shen2, Jianjun Cao3, Yaping Dan1, Xianfeng Chen2, and Wenjie Wan1、2、*
Author Affiliations
  • 1Shanghai Jiao Tong University, University of Michigan-Shanghai Jiao Tong University Joint Institute, State Key Laboratory of Advanced Optical Communication Systems and Networks, Shanghai, China
  • 2Shanghai Jiao Tong University, School of Physics and Astronomy, MOE Key Laboratory for Laser Plasmas and Collaborative Innovation Center of IFSA, Shanghai, China
  • 3Jiangnan University, School of Science, Wuxi, China
  • show less
    DOI: 10.1117/1.AP.3.2.025001 Cite this Article Set citation alerts
    Zhihao Zhou, Wei Liu, Jiajing He, Lei Chen, Xin Luo, Dongyi Shen, Jianjun Cao, Yaping Dan, Xianfeng Chen, Wenjie Wan. Far-field super-resolution imaging by nonlinearly excited evanescent waves[J]. Advanced Photonics, 2021, 3(2): 025001 Copy Citation Text show less
    The working principle of far-field super-resolution imaging based on nonlinearly excited evanescent waves. (a) Schematic of the far-field super-resolution imaging process with localized evanescent-wave illumination excited by the FWM process at the interface. The zoomed inset shows that the FWM process takes place on nonlinear medium’s interface. (b) Mechanism illustrated in Fourier space. NA and k3,0 represent numerical aperture and the free-space wavenumber of the FWM signal beam, respectively. NA×k3,0 determines the cutoff frequency of the imaging system; correspondingly, the blue-circled area represents the system’s passband. Striped-shadow regions represent evanescent fields, which carry sub-wavelength details of the imaging target. In the current experiment, we introduce evanescent wave vector k3,eva along kx as illumination light, which can map evanescent fields into propagating ones and extend the accessible region of the target’s spectrum on dimension kx.
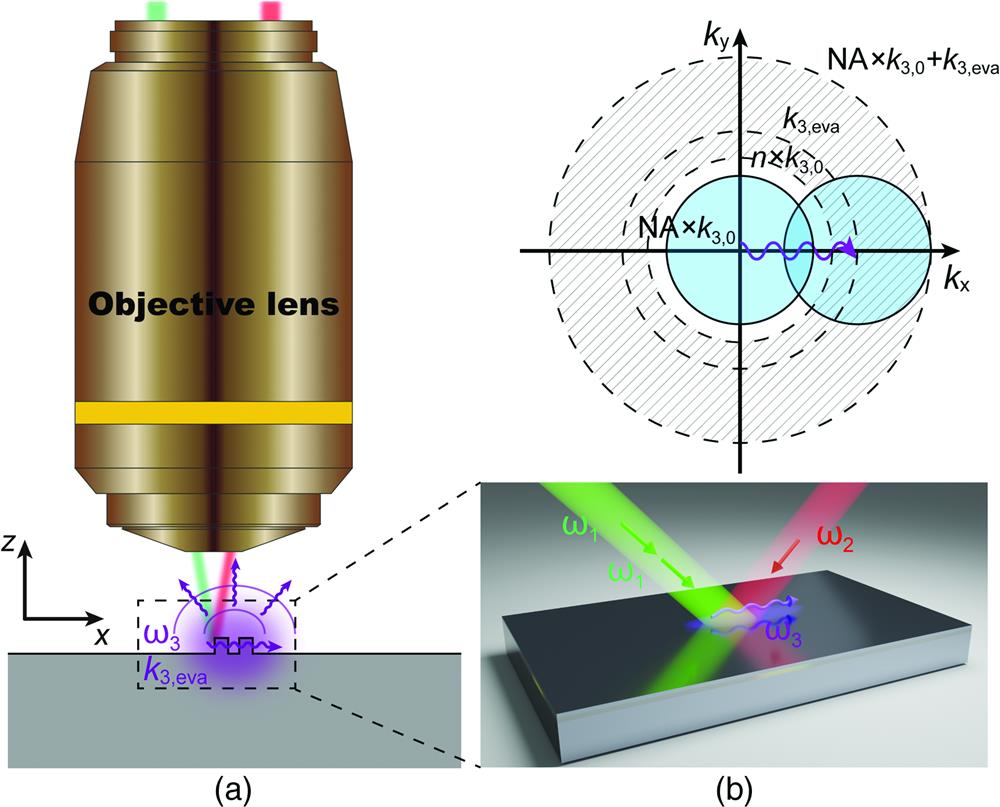
    Fig. 1. The working principle of far-field super-resolution imaging based on nonlinearly excited evanescent waves. (a) Schematic of the far-field super-resolution imaging process with localized evanescent-wave illumination excited by the FWM process at the interface. The zoomed inset shows that the FWM process takes place on nonlinear medium’s interface. (b) Mechanism illustrated in Fourier space. NA and k3,0 represent numerical aperture and the free-space wavenumber of the FWM signal beam, respectively. NA×k3,0 determines the cutoff frequency of the imaging system; correspondingly, the blue-circled area represents the system’s passband. Striped-shadow regions represent evanescent fields, which carry sub-wavelength details of the imaging target. In the current experiment, we introduce evanescent wave vector k3,eva along kx as illumination light, which can map evanescent fields into propagating ones and extend the accessible region of the target’s spectrum on dimension kx.
    Demonstration of wave vector control in surface FWM and local excitation of evanescent waves. (a) Illustration of the FWM process takes place at the interface and the partial-phase-matching condition. (b), (c) Fourier space images of reflected pump/probe beams λ1, λ2, and signal beam λ3 taken by EMCCD, characterizing incident angles, and output angle, respectively. (d) Dependence of FWM output angle θ3 on probe incident angle θ2 under different pump angles θ1. (e) Numerical simulation result of FWM signal field distribution, which is the case of an evanescent wave with a large transverse wave vector k3,eva localized at the top film of SOI. The inset shows the signal’s amplitude variation along with the interface, where the scale bar represents the wavelength of FWM.
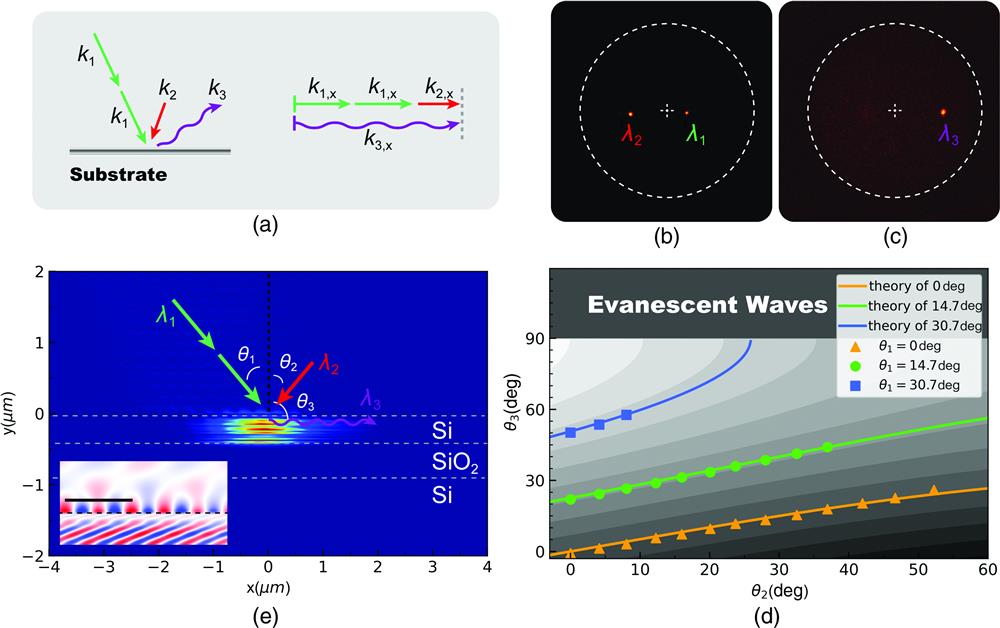
    Fig. 2. Demonstration of wave vector control in surface FWM and local excitation of evanescent waves. (a) Illustration of the FWM process takes place at the interface and the partial-phase-matching condition. (b), (c) Fourier space images of reflected pump/probe beams λ1, λ2, and signal beam λ3 taken by EMCCD, characterizing incident angles, and output angle, respectively. (d) Dependence of FWM output angle θ3 on probe incident angle θ2 under different pump angles θ1. (e) Numerical simulation result of FWM signal field distribution, which is the case of an evanescent wave with a large transverse wave vector k3,eva localized at the top film of SOI. The inset shows the signal’s amplitude variation along with the interface, where the scale bar represents the wavelength of FWM.
    Demonstration of super-resolution imaging using FWM evanescent-wave illumination. Fourier space representation of (a) the probe beam at 780 nm with normal illumination, (b) FWM signal at 403 nm with k3,eva illumination, and (c) the complete imaging method (d)–(f). Simulated images of a pair of 90-nm-wide slits spaced 50 nm apart, corresponding to cases of (a)–(c). (g)–(i) Experimental results. Scale bar: 500 nm. (j) Scanning electron microscopy image of the two-slit target. (k) Inverse-intensity cross-section comparison of probe beam normal illumination image and proposed super-resolution method.
    Fig. 3. Demonstration of super-resolution imaging using FWM evanescent-wave illumination. Fourier space representation of (a) the probe beam at 780 nm with normal illumination, (b) FWM signal at 403 nm with k3,eva illumination, and (c) the complete imaging method (d)–(f). Simulated images of a pair of 90-nm-wide slits spaced 50 nm apart, corresponding to cases of (a)–(c). (g)–(i) Experimental results. Scale bar: 500 nm. (j) Scanning electron microscopy image of the two-slit target. (k) Inverse-intensity cross-section comparison of probe beam normal illumination image and proposed super-resolution method.
    Super-resolved nano-slit grating and evanescent wave excitation on the grating. (a) and (b) Simulated images of a slit array with 110-nm slit width and 400-nm period by probe beam illumination and our super-resolution method, respectively. (c) and (d) Experimental results. Scale bar: 1 μm. (e) Cross-section comparison of the two cases, showing a great improvement in resolution by our method. (f) Experimental demonstration of the modified partial-phase-matching condition mixed with grating modes when θ2=41 deg, solid lines are the theoretical prediction calculated from Eq. (4), and insets show typical k-space images used to estimate the signal’s output angles. (g) Partial-phase-matching condition mixed with grating modes −G, making the FWM signal become propagating waves. (h) Partial-phase-matching condition mixed with G, resulting in a further increment of k3,eva.
    Fig. 4. Super-resolved nano-slit grating and evanescent wave excitation on the grating. (a) and (b) Simulated images of a slit array with 110-nm slit width and 400-nm period by probe beam illumination and our super-resolution method, respectively. (c) and (d) Experimental results. Scale bar: 1  μm. (e) Cross-section comparison of the two cases, showing a great improvement in resolution by our method. (f) Experimental demonstration of the modified partial-phase-matching condition mixed with grating modes when θ2=41  deg, solid lines are the theoretical prediction calculated from Eq. (4), and insets show typical k-space images used to estimate the signal’s output angles. (g) Partial-phase-matching condition mixed with grating modes G, making the FWM signal become propagating waves. (h) Partial-phase-matching condition mixed with G, resulting in a further increment of k3,eva.
    Zhihao Zhou, Wei Liu, Jiajing He, Lei Chen, Xin Luo, Dongyi Shen, Jianjun Cao, Yaping Dan, Xianfeng Chen, Wenjie Wan. Far-field super-resolution imaging by nonlinearly excited evanescent waves[J]. Advanced Photonics, 2021, 3(2): 025001
    Download Citation