• Acta Optica Sinica
  • Vol. 41, Issue 18, 1816001 (2021)
Guang Yang1, Daming Hu1, Chuanfan Yang1, Xiaoyan He1、2、*, and Viktor Takats3、**
Author Affiliations
  • 1School of Materials Science and Engineering, Shanghai University, Shanghai 200444, China
  • 2Editorial Office of Electrochemical Energy Reviews, Periodicals Agency of Shanghai University, Shanghai University, Shanghai 200444, China
  • 3Institute for Nuclear Research, Hungarian Academy of Sciences, Debrecen 4001, Hungary
  • show less
    DOI: 10.3788/AOS202141.1816001 Cite this Article Set citation alerts
    Guang Yang, Daming Hu, Chuanfan Yang, Xiaoyan He, Viktor Takats. Microstructured SHG Patterns Imprinted on Soda Lime Glass Using Microthermal Poling[J]. Acta Optica Sinica, 2021, 41(18): 1816001 Copy Citation Text show less
    Schematic of microthermal poling sandwich and image of Ni mesh. (a) Schematic; (b) image of Ni mesh
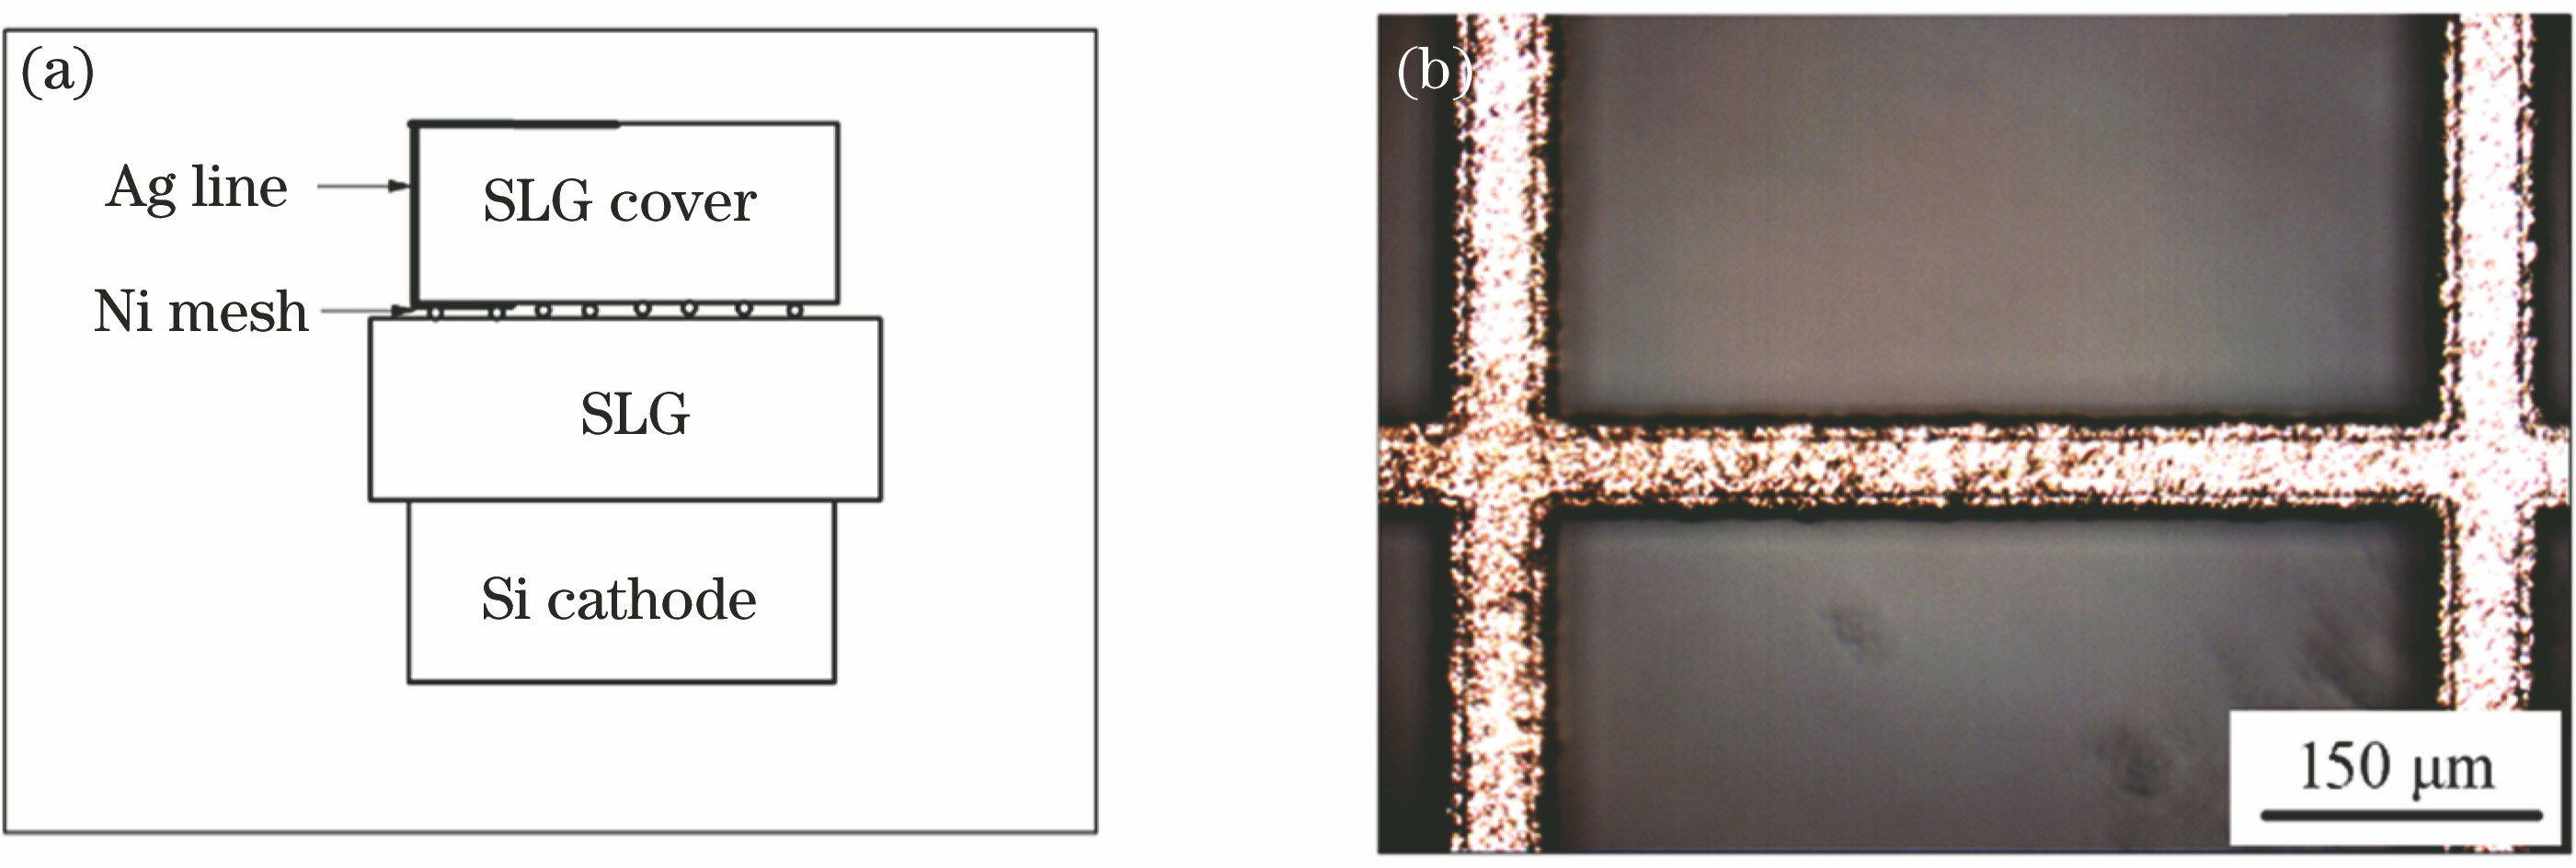
    Fig. 1. Schematic of microthermal poling sandwich and image of Ni mesh. (a) Schematic; (b) image of Ni mesh
    SHG patterns. (a) Microstructured SHG pattern of SLG sample poled at 240 ℃ and 1.8 kV in N2 for 0.5 h; (b) microstructured SHG pattern of SLG cover glass; (c) overlapping the sample and the cover glass
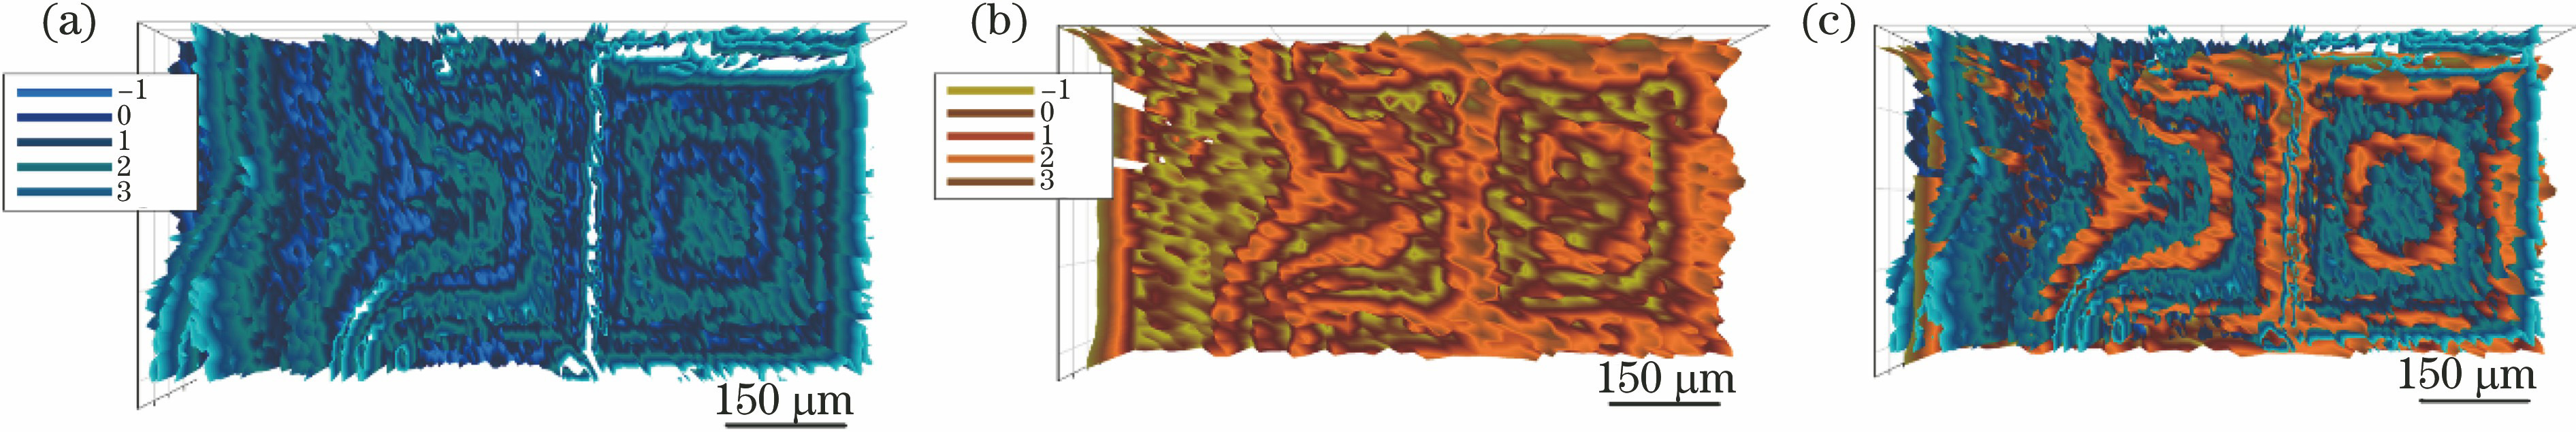
    Fig. 2. SHG patterns. (a) Microstructured SHG pattern of SLG sample poled at 240 ℃ and 1.8 kV in N2 for 0.5 h; (b) microstructured SHG pattern of SLG cover glass; (c) overlapping the sample and the cover glass
    Variation of voltage and current with time and in situ DBD images of an anode sandwich overlapping an SLG sample, a mesh and an SLG cover glass recorded during the micro-thermal-poling process. (a) Voltage and current versus time; (b) onset of DBD; (c) first quadrate of DBD; (d) second quadrate of DBD; (e) center of DBD; (f) 10 min after saturation of DBD
    Fig. 3. Variation of voltage and current with time and in situ DBD images of an anode sandwich overlapping an SLG sample, a mesh and an SLG cover glass recorded during the micro-thermal-poling process. (a) Voltage and current versus time; (b) onset of DBD; (c) first quadrate of DBD; (d) second quadrate of DBD; (e) center of DBD; (f) 10 min after saturation of DBD
    DBD mechanism diagram
    Fig. 4. DBD mechanism diagram
    Raman spectra. (a) Raman spectra of three positions for SLG sample; (b) variation of relative intensity of O—O bond across a square
    Fig. 5. Raman spectra. (a) Raman spectra of three positions for SLG sample; (b) variation of relative intensity of O—O bond across a square
    Distribution of Na+ ions. (a)(b) Distribution of Na+ ions on sample surface and linear distribution of Na+ ions along dash line; (c)(d) distribution of Na+ ions on cover surface and linear distribution of Na+ ions along dash line
    Fig. 6. Distribution of Na+ ions. (a)(b) Distribution of Na+ ions on sample surface and linear distribution of Na+ ions along dash line; (c)(d) distribution of Na+ ions on cover surface and linear distribution of Na+ ions along dash line
    Guang Yang, Daming Hu, Chuanfan Yang, Xiaoyan He, Viktor Takats. Microstructured SHG Patterns Imprinted on Soda Lime Glass Using Microthermal Poling[J]. Acta Optica Sinica, 2021, 41(18): 1816001
    Download Citation