
Chen Zhang, Peipei Hu, Xinwang Zhu, Changqi Yang. Intelligent Online Detection of Laser Welding Defects Based on High Density Point Clouds (Invited)[J]. Chinese Journal of Lasers, 2024, 51(4): 0402105
- Chinese Journal of Lasers
- Vol. 51, Issue 4, 0402105 (2024)
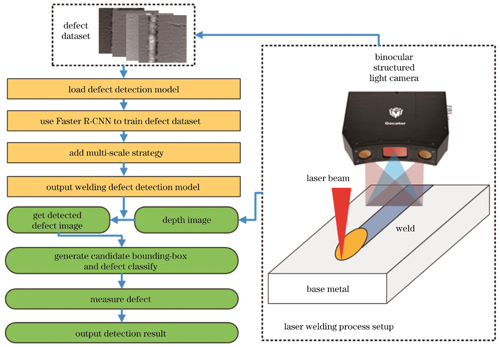
Fig. 1. Overall workflow chart of defect detection
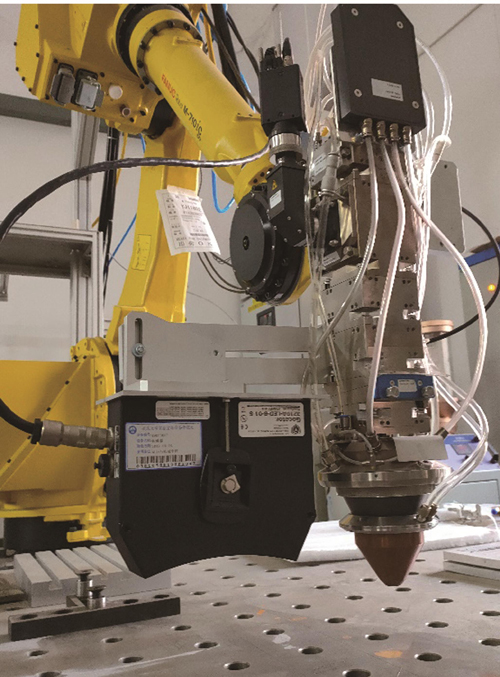
Fig. 2. Experiment system for laser welding defect detection
Fig. 3. Complete sample images of typical welds. (a) Sheet butt weld;(b) thick plate butt weld; (c) bead-on-plate weld
Fig. 4. Different forms of data during data preprocessing. (a) Preprocessing of point cloud HDM data; (b) RGB images of surface defects; (c) high-density point cloud data; (d) depth images including 3D profile information of defects
Fig. 5. Structural diagram of Faster R-CNN
Fig. 6. Detection results using Faster R-CNNs based on ResNet18, ResNet50, and ResNet101
Fig. 7. Statistical results of three models. (a) Loss evolution of different models; (b) point cloud detection precisions and recall rates with different models; (c) detection precisions and recall rates of defects for point clouds and RGB images with different models; (d) detection mAPs of defects for point clouds and RGB images with different models; (e) testing time of different models
Fig. 8. Typical false negative test results of Faster R-CNN model based on ResNet50
Fig. 9. Measurement process of defect sizes. (a) RGB images; (b) point clouds; (c) depth gray images; (d) threshold segmentation; (e) locating defect areas; (f) defect feature size measurement
Fig. 10. Relative errors of defect measurement results
|
Table 1. Specific parameters of binocular structured light sensor
| ||||||||||||||||||||||
Table 2. Welding parameters
|
Table 3. Datasets after data augmentation
|
Table 4. Performance parameters of three models based on point cloud analysis
|
Table 5. Measurement results of defect sizes

Set citation alerts for the article
Please enter your email address
© Copyright 2018-2021 | Chinese Laser Press. All Rights Reserved 沪ICP备15018463号-20