• Laser & Optoelectronics Progress
  • Vol. 55, Issue 4, 043001 (2018)
Wenhao Lai*, Mengran Zhou, Ya Wang, Feng Hu, Datong Li, and Shun Zhao
Author Affiliations
  • 1School of Electrical and Information Engineering, Anhui University of Science and Technology, Huainan, Anhui 232000, China
  • show less
    DOI: 10.3788/LOP55.043001 Cite this Article Set citation alerts
    Wenhao Lai, Mengran Zhou, Ya Wang, Feng Hu, Datong Li, Shun Zhao. Application of Counterfeit Liquor Recognition Based on Deep Learning and Laser Induced Fluorescence[J]. Laser & Optoelectronics Progress, 2018, 55(4): 043001 Copy Citation Text show less
    LIF system structure diagram
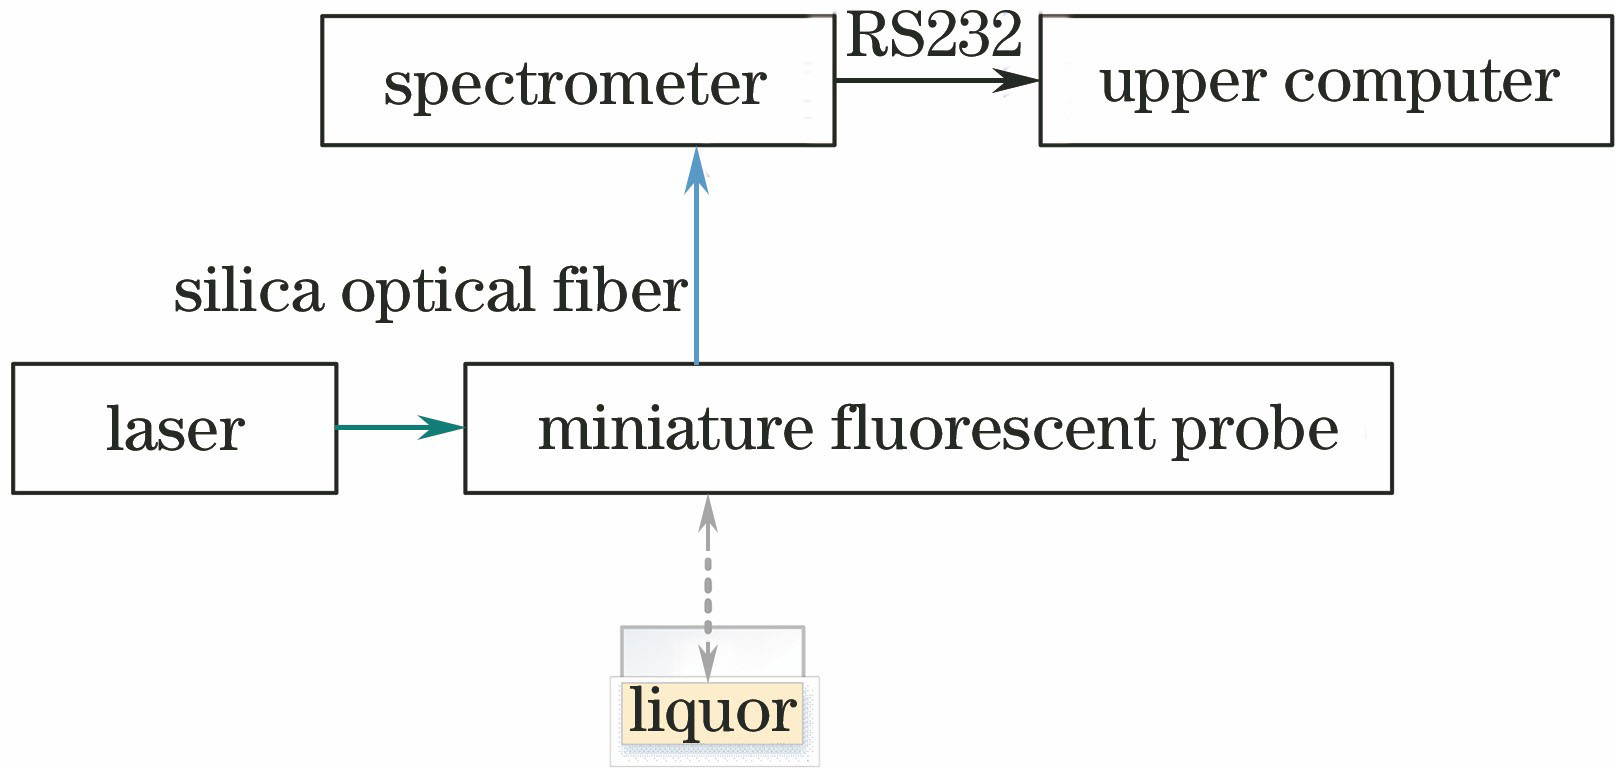
    Fig. 1. LIF system structure diagram
    Fluorescence spectra of four samples
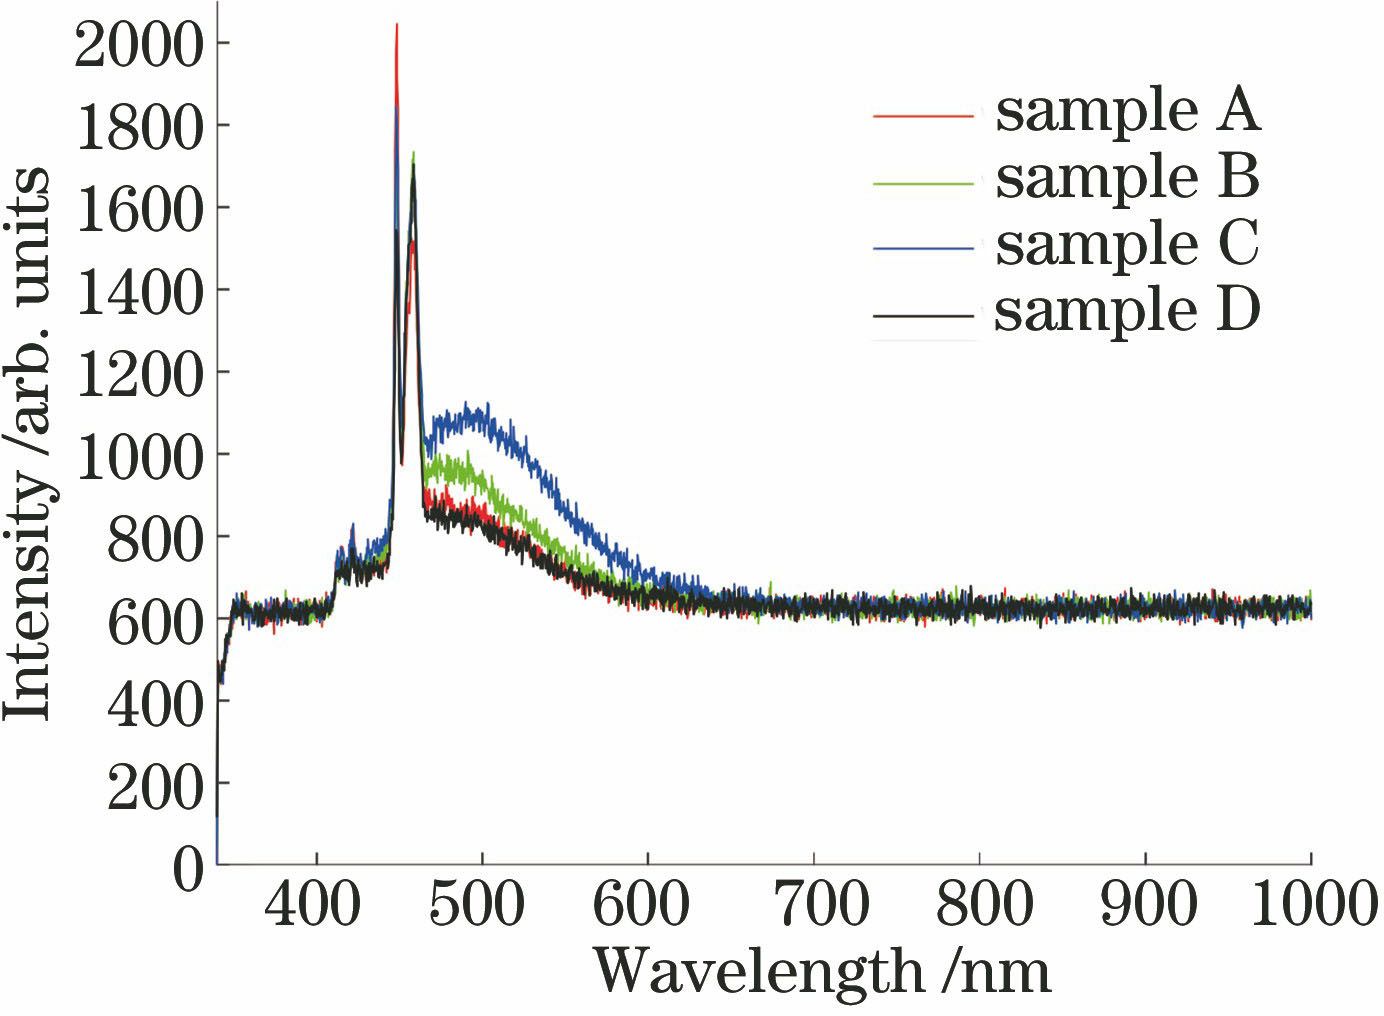
    Fig. 2. Fluorescence spectra of four samples
    (a) Fluorescence spectra of samples with same brand and different degrees; (b) local diagram of the first wave peak; (c) local diagram of the second wave peak; (d) local fluorescence spectra in band of 465-500 nm
    Fig. 3. (a) Fluorescence spectra of samples with same brand and different degrees; (b) local diagram of the first wave peak; (c) local diagram of the second wave peak; (d) local fluorescence spectra in band of 465-500 nm
    (a) Fluorescence spectra of samples with different brands and same degree; (b) local diagram of the first wave peak; (c) local diagram of the second wave peak; (d) local fluorescence spectra in band of 465-500 nm
    Fig. 4. (a) Fluorescence spectra of samples with different brands and same degree; (b) local diagram of the first wave peak; (c) local diagram of the second wave peak; (d) local fluorescence spectra in band of 465-500 nm
    (a) Fluorescence spectra of samples with different brands and same degree of 42; (b) local diagram of the first wave peak; (c) local diagram of the second wave peak; (d) local fluorescence spectra in band of 465-500 nm
    Fig. 5. (a) Fluorescence spectra of samples with different brands and same degree of 42; (b) local diagram of the first wave peak; (c) local diagram of the second wave peak; (d) local fluorescence spectra in band of 465-500 nm
    Spectra of the input model. (a) Sample A; (b) sample B; (c) sample C; (d) sample D
    Fig. 6. Spectra of the input model. (a) Sample A; (b) sample B; (c) sample C; (d) sample D
    Deep learning model flow chart
    Fig. 7. Deep learning model flow chart
    Deep learning model training process curves
    Fig. 8. Deep learning model training process curves
    Iteration numberRecognition rate /%
    300098.44
    Table 1. Classification test result of liquor spectrum
    AlgorithmRecognition rate /%
    Deep learning98.44
    BP neural network93.75
    Table 2. Results of classification test of liquor spectrum
    Wenhao Lai, Mengran Zhou, Ya Wang, Feng Hu, Datong Li, Shun Zhao. Application of Counterfeit Liquor Recognition Based on Deep Learning and Laser Induced Fluorescence[J]. Laser & Optoelectronics Progress, 2018, 55(4): 043001
    Download Citation