
Jiangtao Guo, Jiangfeng Wang, Hui Wei, Wenfa Huang, Tingrui Huang, Gang Xia, Wei Fan, Zunqi Lin. High-power, Joule-class, temporally shaped multi-pass ring laser amplifier with two Nd:glass laser heads[J]. High Power Laser Science and Engineering, 2019, 7(1): 010000e8
- High Power Laser Science and Engineering
- Vol. 7, Issue 1, 010000e8 (2019)
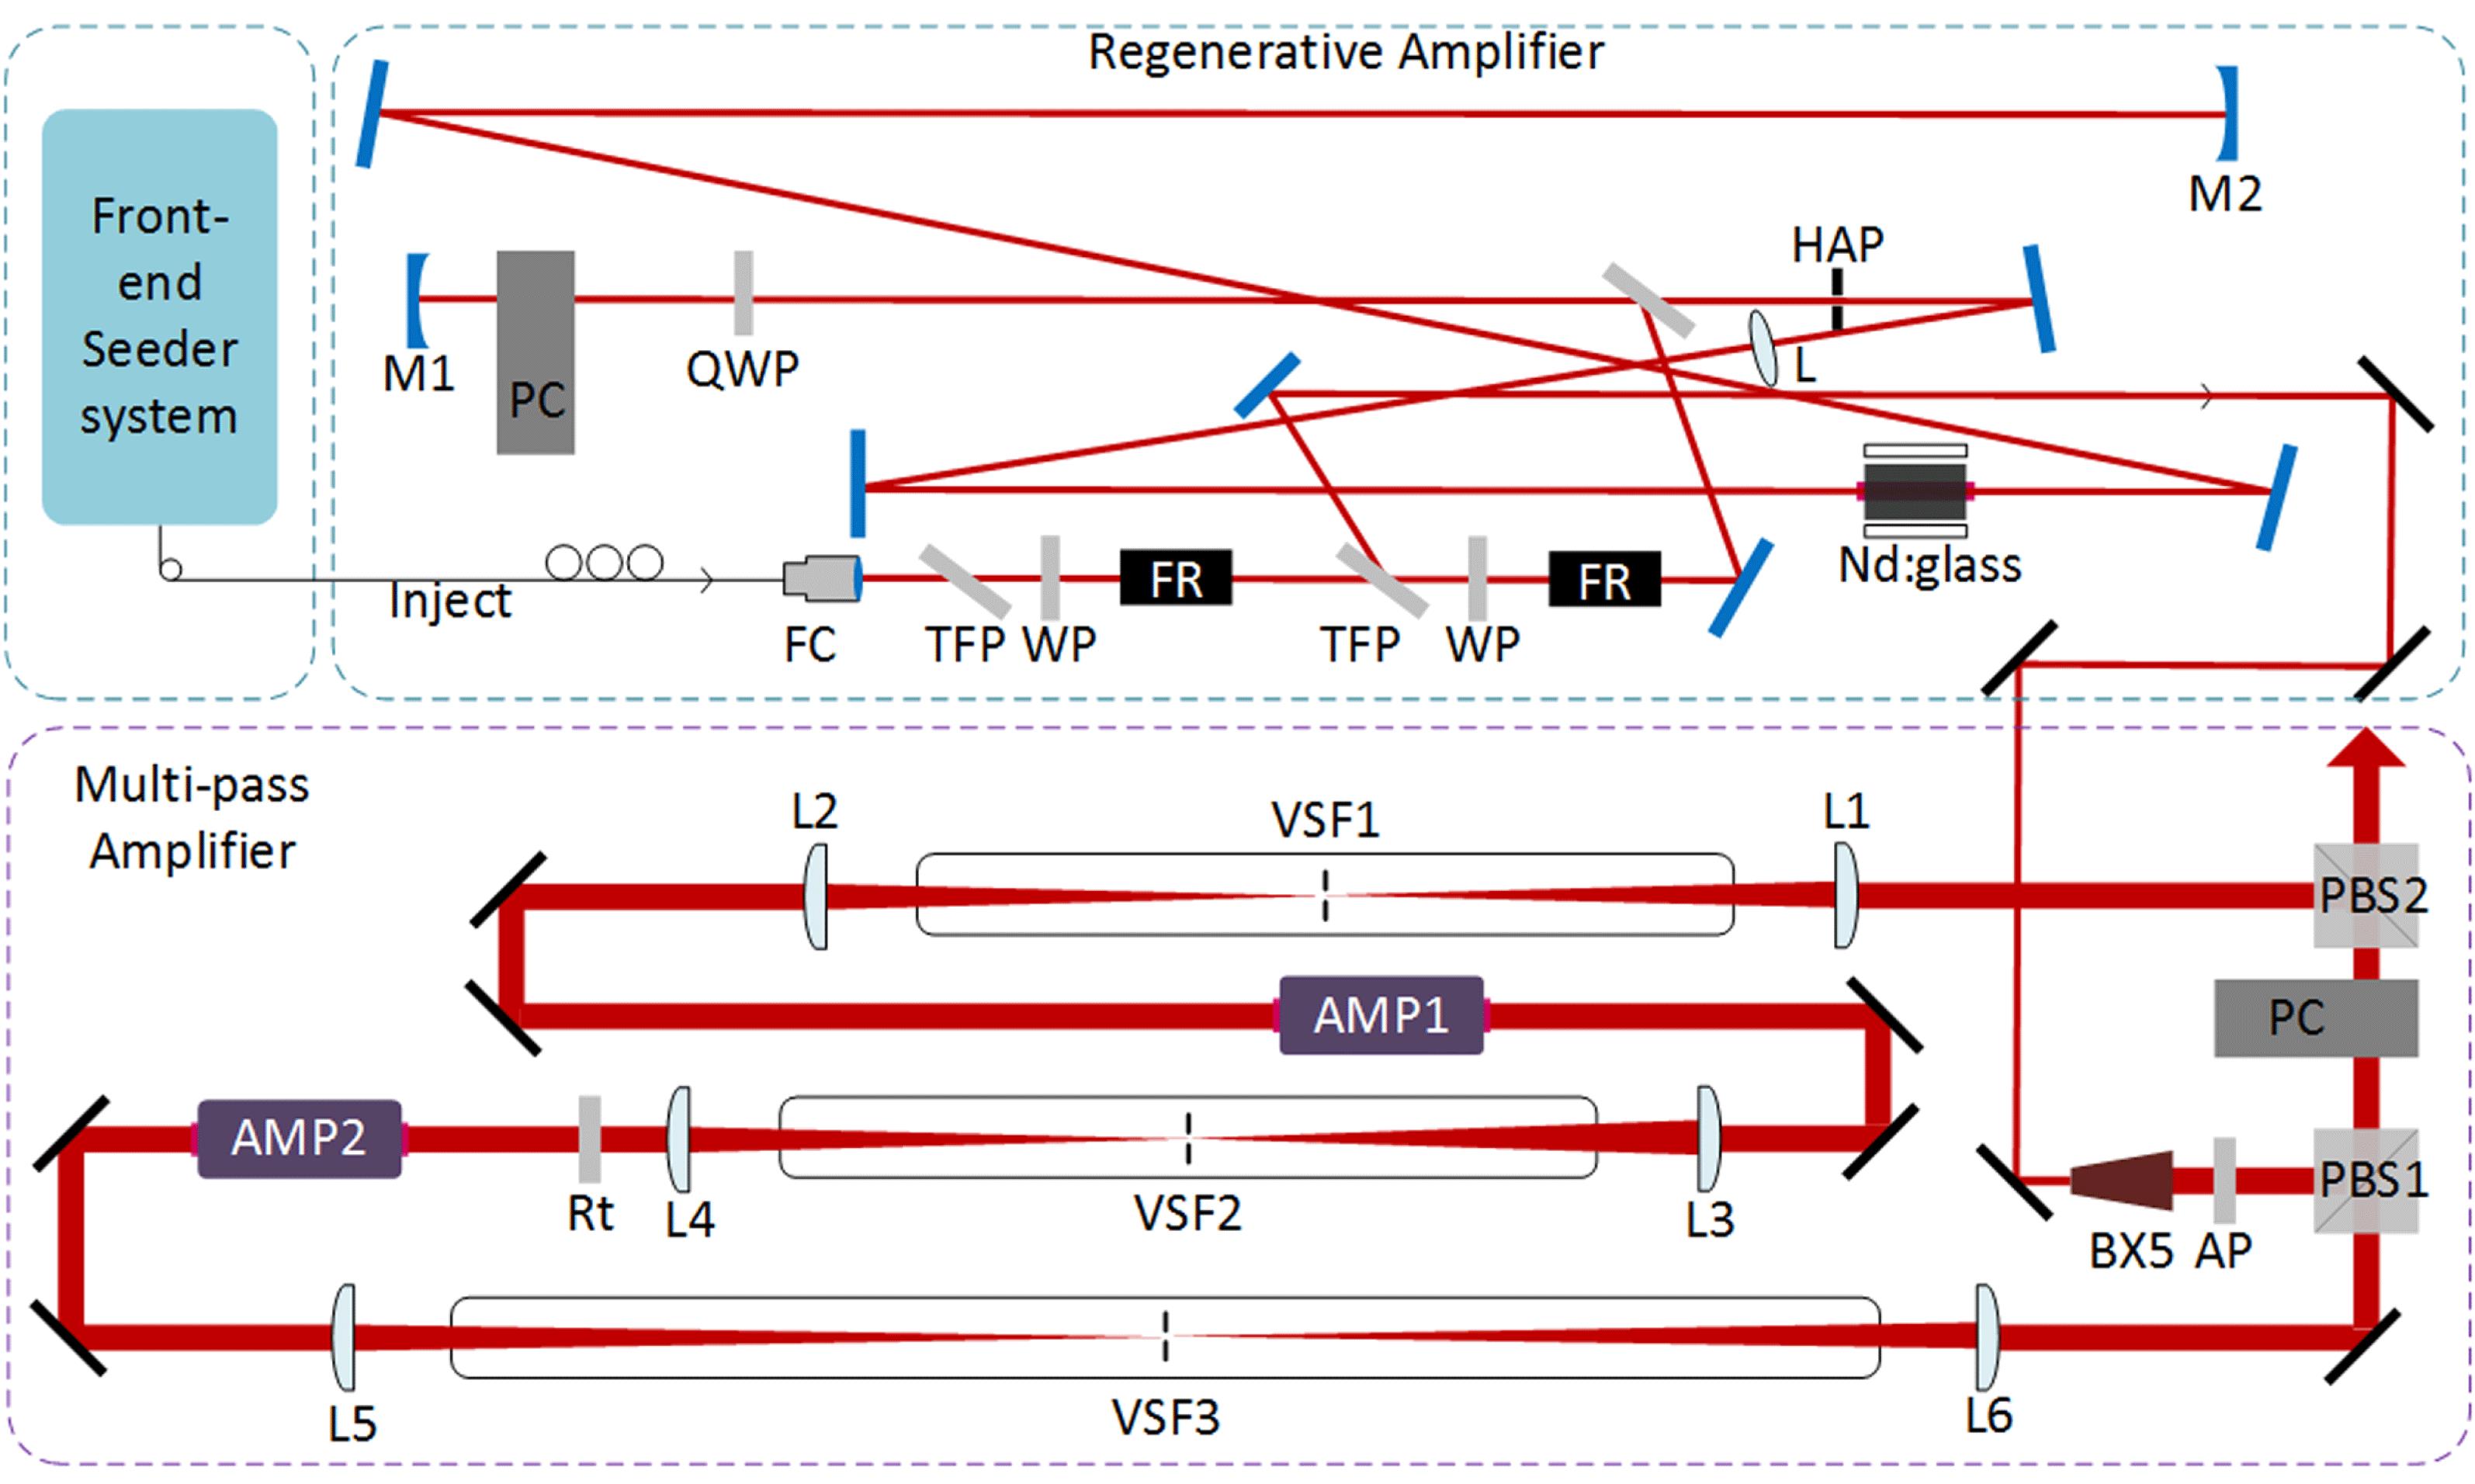
Fig. 1. Schematic of the regenerative amplifier and multi-pass amplifier. FC, fiber beam collimator; TFP, thin-film polarizer; WP, half-wave plate; QWP, quarter-wave plate; FR, Faraday rotator; M1, M2, cavity concave mirrors; PC, Pockels cell; AMP, laser head with a diode-pumped Nd:glass rod in the center surrounded by laser diode bars; L, biconvex lens; HAP, hard aperture; BX5, $5\times$ beam expander; AP, $8.1~\text{mm}\times 8.1~\text{mm}$ square soft edge aperture; PBS, polarization beam splitter; L1–L6, plane-convex lenses; VSF1–VSF3, vacuum spatial filters; AMP1, AMP2, two identical laser heads with Nd:glass rod in center surrounded by four xenon lamps.
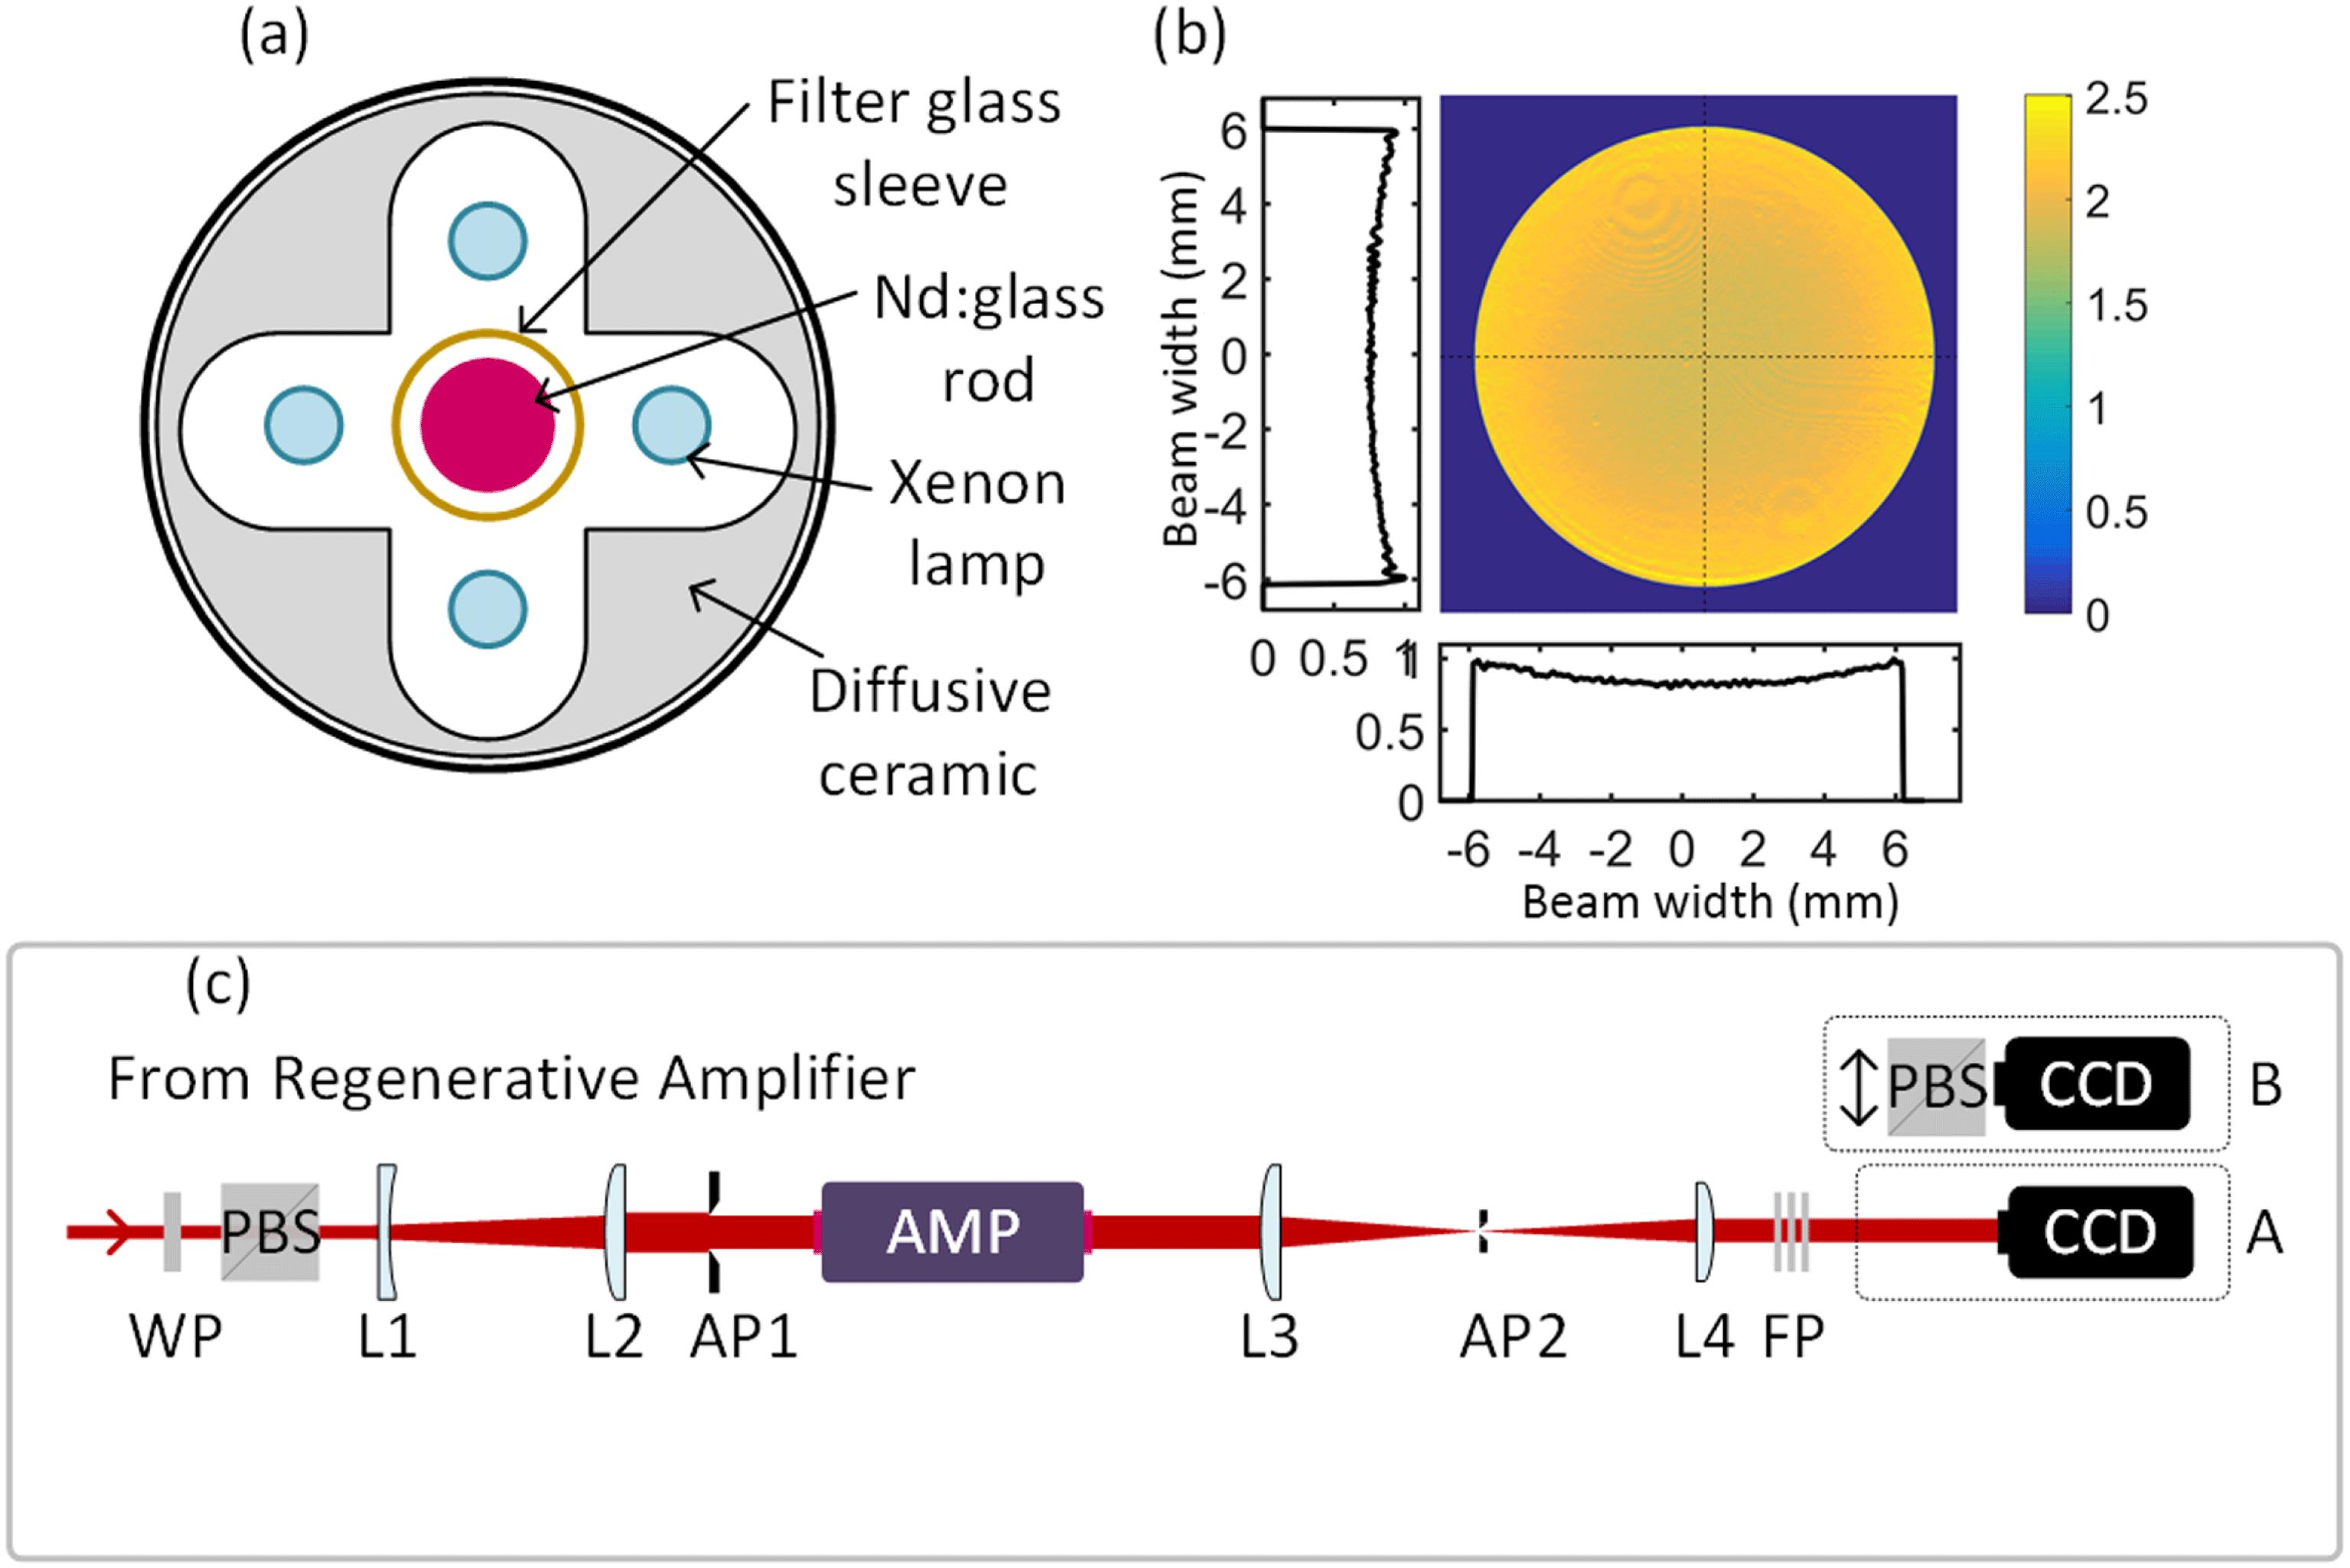
Fig. 2. (a) Outline of the laser heads cross-section pumped by four xenon lamps. (b) Two-dimensional small signal gain distribution of the xenon lamp laser head. (c) Outline measurement of the small signal gain and degree of depolarization. WP, half-wave plate; PBS, polarization beam splitter; L1, plano-concave lens with focal length of $-100~\text{mm}$ ; L2, plano-convex lens with focal length of 400 mm; AP1, hard edge aperture; AMP, the laser head or some other optical element to be measured; L3, L4, plano-convex lenses with focal lengths of 750 mm and 500 mm, respectively; AP2, pinhole in the focus plane of L3; FP, neutral density filters and 1053 bandpass filters; A and B are two adjustable options for different measurements, two-dimensional small signal gain distribution and two-dimensional degree of polarization, respectively.
Fig. 3. (a) The average small signal gain of the laser rods cross-section versus different pump power and (b) the integral DOP of the laser rods cross-section versus different pump power for the two laser heads, AMP1 and AMP2. The two images (Iout and Idep) in (b) are typical two-dimensional main beam intensity and depolarization beam intensity distribution in measurement.
Fig. 4. Simulation and experimental measurement of the thermal depolarization compensation. The depolarization output, main beam output and the DOP are shown in (a), (b) and (c), respectively. (d), (e), and (f) show that the experimental measurement produces three types of output.
Fig. 5. Energy output versus the number of round trips. The blue circles and the red curve correspond to the experimental and simulation results, respectively.
Fig. 6. (a) Near field and (b) far field profiles of the multi-pass laser amplifier output at 1 Hz, 0.969 J operation. Also shown are the $x$ and $y$ axis cross-sectional profiles.
Fig. 7. Temporal pulse waveforms of the injection seeder source (Seeder), after passing through the regenerative amplifier (Regen), and after passing through the multi-pass amplifier (Multi-pass), with injected (a) square pulse shape and (b) pre-compensation pulse shape.

Set citation alerts for the article
Please enter your email address
© Copyright 2018-2021 | Chinese Laser Press. All Rights Reserved 沪ICP备15018463号-20