
Xinyu Liu, Zheng Yan, Fang Duan, Zhongying Dai. Tracking of Human Respiratory Motion Based on Kanade-Lucas-Tomasi Algorithm[J]. Laser & Optoelectronics Progress, 2020, 57(22): 221001
- Laser & Optoelectronics Progress
- Vol. 57, Issue 22, 221001 (2020)
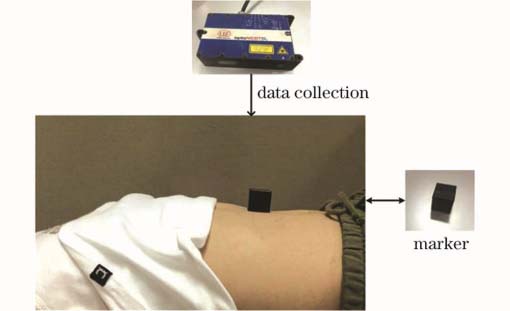
Fig. 1. Schematic diagram of experiment 1
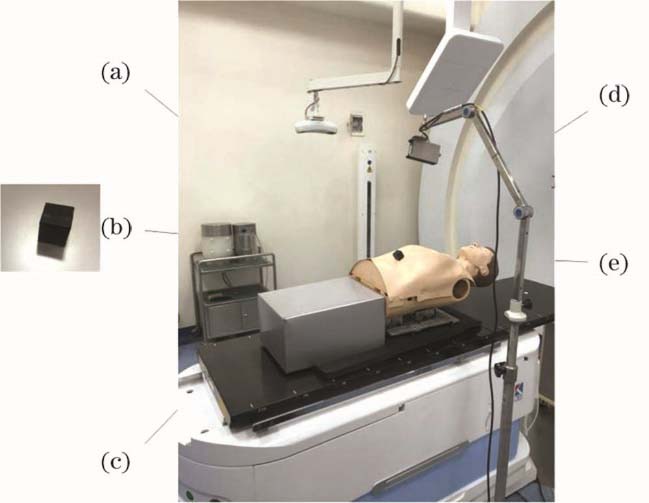
Fig. 2. Schematic diagram of experiment 2
Fig. 3. Flow chart of image pre-processing
Fig. 4. Flow chart of tracking algorithm
Fig. 5. Results of pre-processing. (a) Original image; (b) down-sampled image; (c) image filtered by Lee filter; (d) image filtered by Kuwahara filter; (e) image denoised by Gaussian filter; (f) edge detection result with Canny operator
Fig. 6. Tracking results of experiment 1. (a) Mark four corner points of marker in first frame manually; (b) ROI calculated by algorithm according to marked coordinates of corner points; (c) tracking result of 100th frame with KLT algorithm
Fig. 7. Curves of actual displacement of body surface and pixel difference between ordinate frames of ROI corner points
Fig. 8. Tracking results from three perspectives
Fig. 9. Comparison of phantom motion curves and algorithm tracking curves under three breathing conditions. (a) Three breathing conditions; (b) phantom motion curves; (c) algorithm tracking curves
Fig. 10. Actual displacement of marker and pixel difference between feature points
Fig. 11. Error bar of tracking experimental results
|
Table 1. Table of comparison of actual displacement and pixel difference between frames
|
Table 2. Comparison of actual displacement and changes in position of central point of ROI

Set citation alerts for the article
Please enter your email address
© Copyright 2018-2021 | Chinese Laser Press. All Rights Reserved 沪ICP备15018463号-20