
Huanhuan Lü, Tao Liu, Hui Zhang, Guofeng Peng, Juntong Zhang. High-Resolution Remote Sensing Scene Classification Based on Salient Features and DCNN[J]. Laser & Optoelectronics Progress, 2021, 58(20): 2001002
- Laser & Optoelectronics Progress
- Vol. 58, Issue 20, 2001002 (2021)
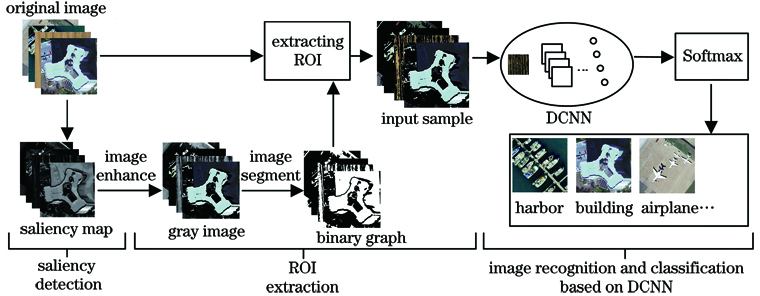
Fig. 1. Flow chart of our method
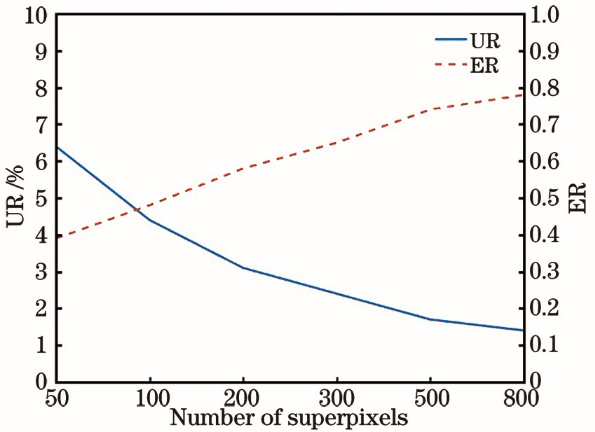
Fig. 2. Segmentation results with different number of superpixels
Fig. 3. Extraction result of saliency map. (a) Original image; (b) K-means clustering; (c) superpixel segmentation; (d) fusion result
Fig. 4. Extraction result of the ROI. (a) Saliency map;(b) gray enhancement map; (c) binarization map; (d) ROI
Fig. 5. Structure of the DCNN
Fig. 6. Expanded results of the data. (a) Original image; (b) horizontal flip; (c) vertical flip; (d) brightness adjustment
Fig. 7. Loss function and classification accuracy of different models. (a) UC-Merced data set; (b) WHU-RS data set
Fig. 8. Images in different data sets. (a) UC-Merced data set; (b) WHU-RS data set
Fig. 9. Experimental results of the UC-Merced data set. (a) Original image; (b) saliency map; (c) gray enhancement map; (d) binarization map; (e) ROI
Fig. 10. Confusion matrix of our method on the UC-Merced data set
Fig. 11. Experimental results in the WHU-RS data set. (a) Original image; (b) saliency map; (c) gray enhancement map; (d) binarization map; (e) ROI
Fig. 12. Confusion matrix of our method on the WHU-RS data set
| |||||||||||||||||||||||||||||||||||||||||||||||||||||||||||||||||||||||||||||||||
Table 1. Classification accuracy of the UC-Merced data set unit: %
|
Table 2. Classification accuracies of different methods on the UC-Merced data set
| |||||||||||||||||||||||||||||||||||||||||||||||||||||||||||||||||||||||||||||||||
Table 3. Classification accuracy of the WHU-RS data set unit: %
|
Table 4. Classification accuracies of different methods on the WHU-RS data set

Set citation alerts for the article
Please enter your email address
© Copyright 2018-2021 | Chinese Laser Press. All Rights Reserved 沪ICP备15018463号-20