• Chinese Optics Letters
  • Vol. 21, Issue 1, 010003 (2023)
Wanxia Huang*, Yabo Zhang, Yuan Pei, Maosheng Wang, Fenghua Shi, and Kuanguo Li
Author Affiliations
  • Anhui Key Laboratory of Optoelectric Materials Science and Technology, School of Physics and Electronic Information, Anhui Normal University, Wuhu 241002, China
  • show less
    DOI: 10.3788/COL202321.010003 Cite this Article Set citation alerts
    Wanxia Huang, Yabo Zhang, Yuan Pei, Maosheng Wang, Fenghua Shi, Kuanguo Li. Effects of propagation phase on the coupling of plasmonic optical modes[J]. Chinese Optics Letters, 2023, 21(1): 010003 Copy Citation Text show less
    Schematic diagram of the unit cell with the corresponding structural parameters. (a) The perspective view, (b) the top view, and (c) the side view.
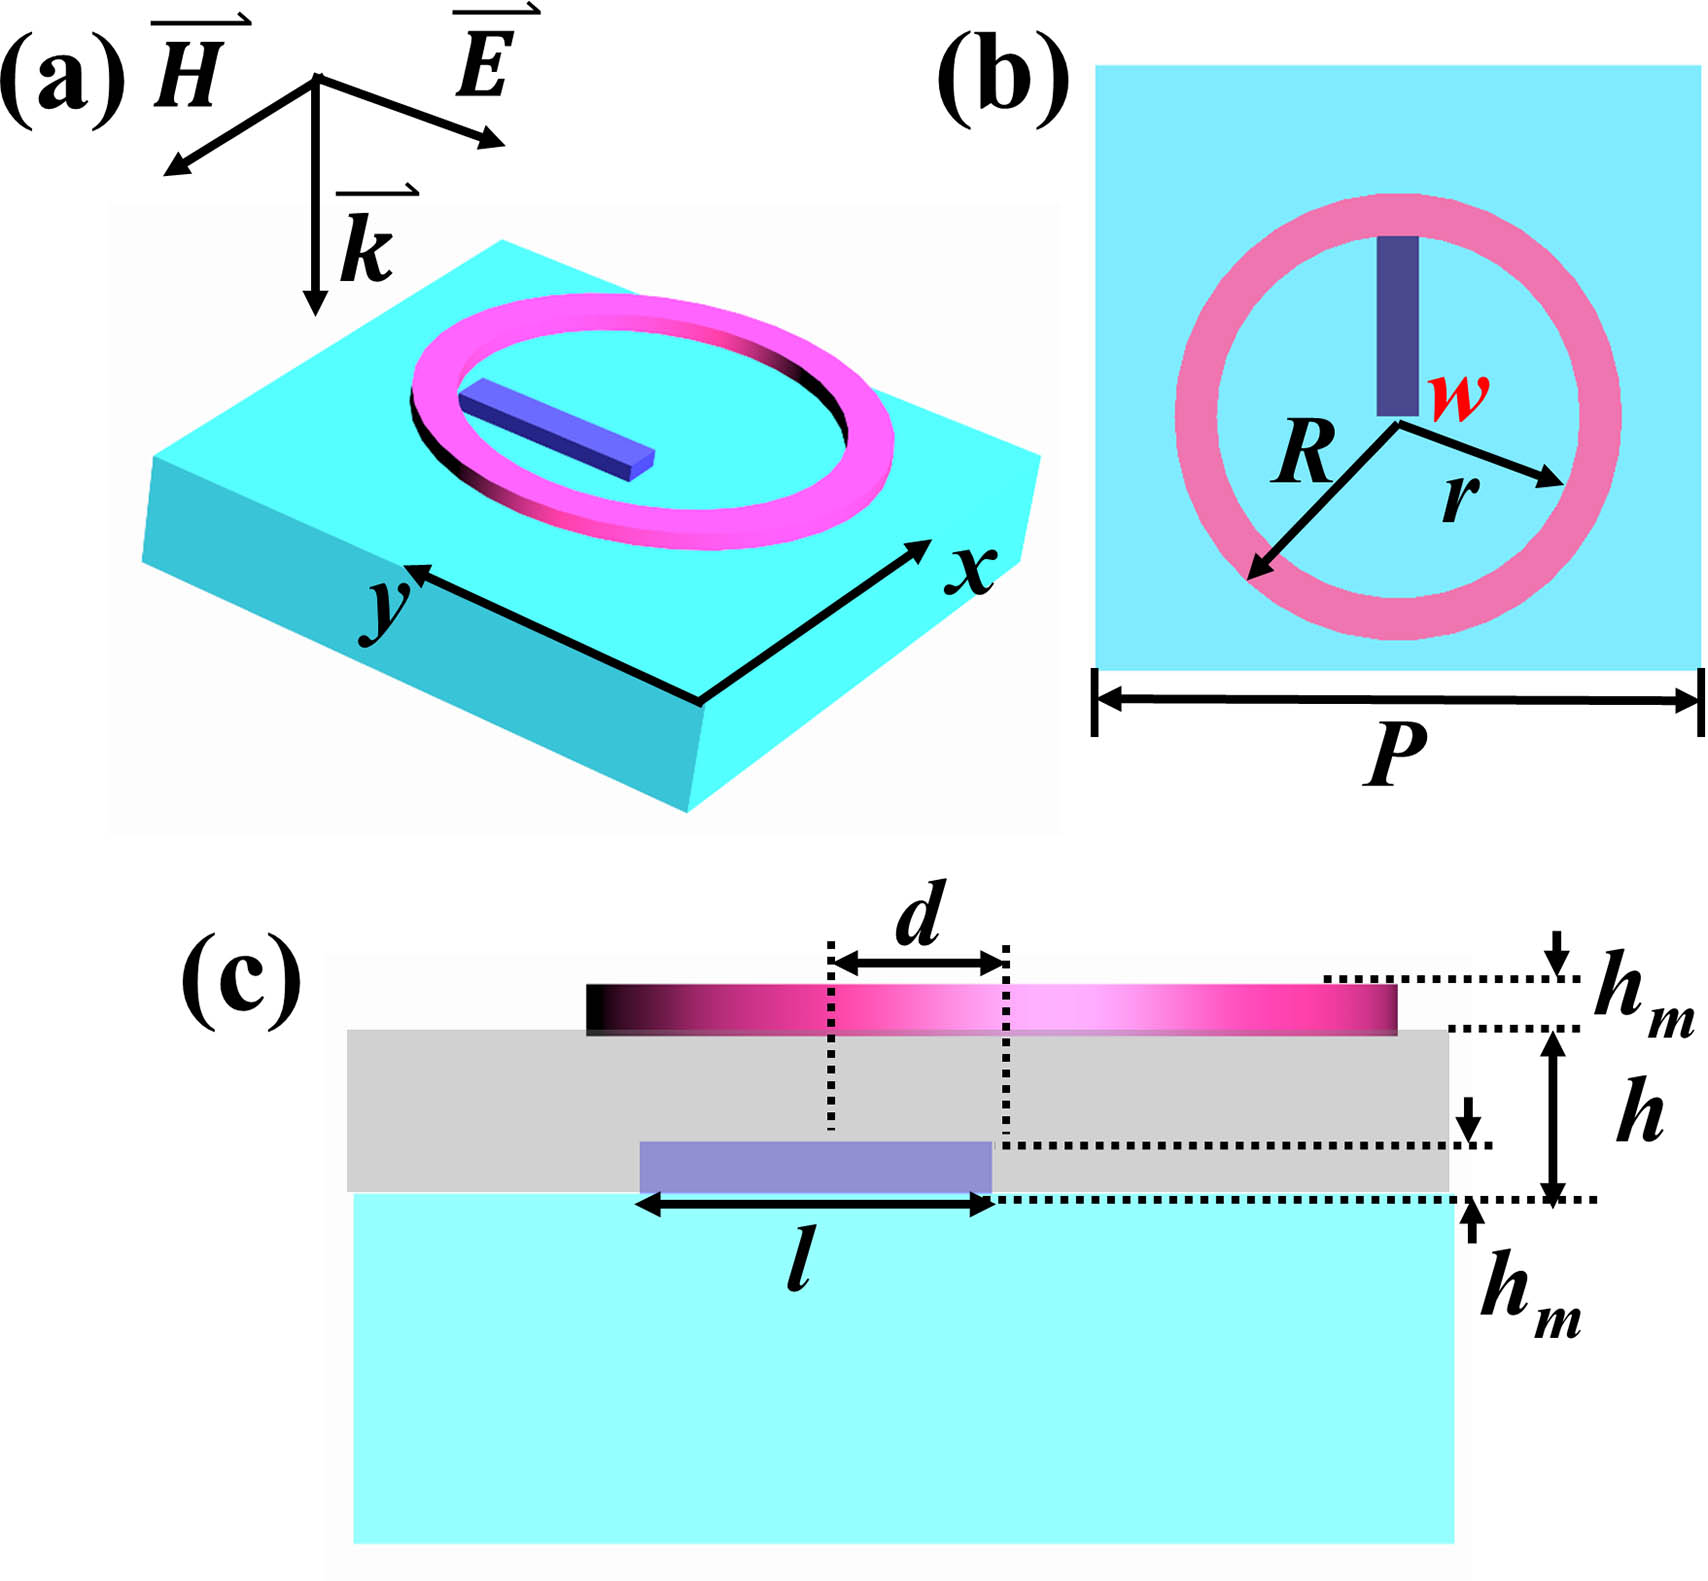
    Fig. 1. Schematic diagram of the unit cell with the corresponding structural parameters. (a) The perspective view, (b) the top view, and (c) the side view.
    Simulated (a) zeroth-order transmittance spectra, (b) reflection spectra, and (c) absorption spectra as a function of asymmetric degree d. (d)–(g) Simulated Re(Hz) patterns of the nanostructure corresponding to the absorption peak A, peak B, peak C, and peak D, respectively. (d) Simulated Re(Hz) patterns of the nanostructure with d = 60 nm at frequency fA = 180.4 THz. (e), (f) Simulated Re(Hz) patterns of the nanostructure with d = 180 nm at frequency fB = 189.1 THz and fC = 167.2 THz, respectively. (g) Simulated Re(Hz) patterns of the nanostructure with d = 360 nm at frequency fD = 173.7 THz.
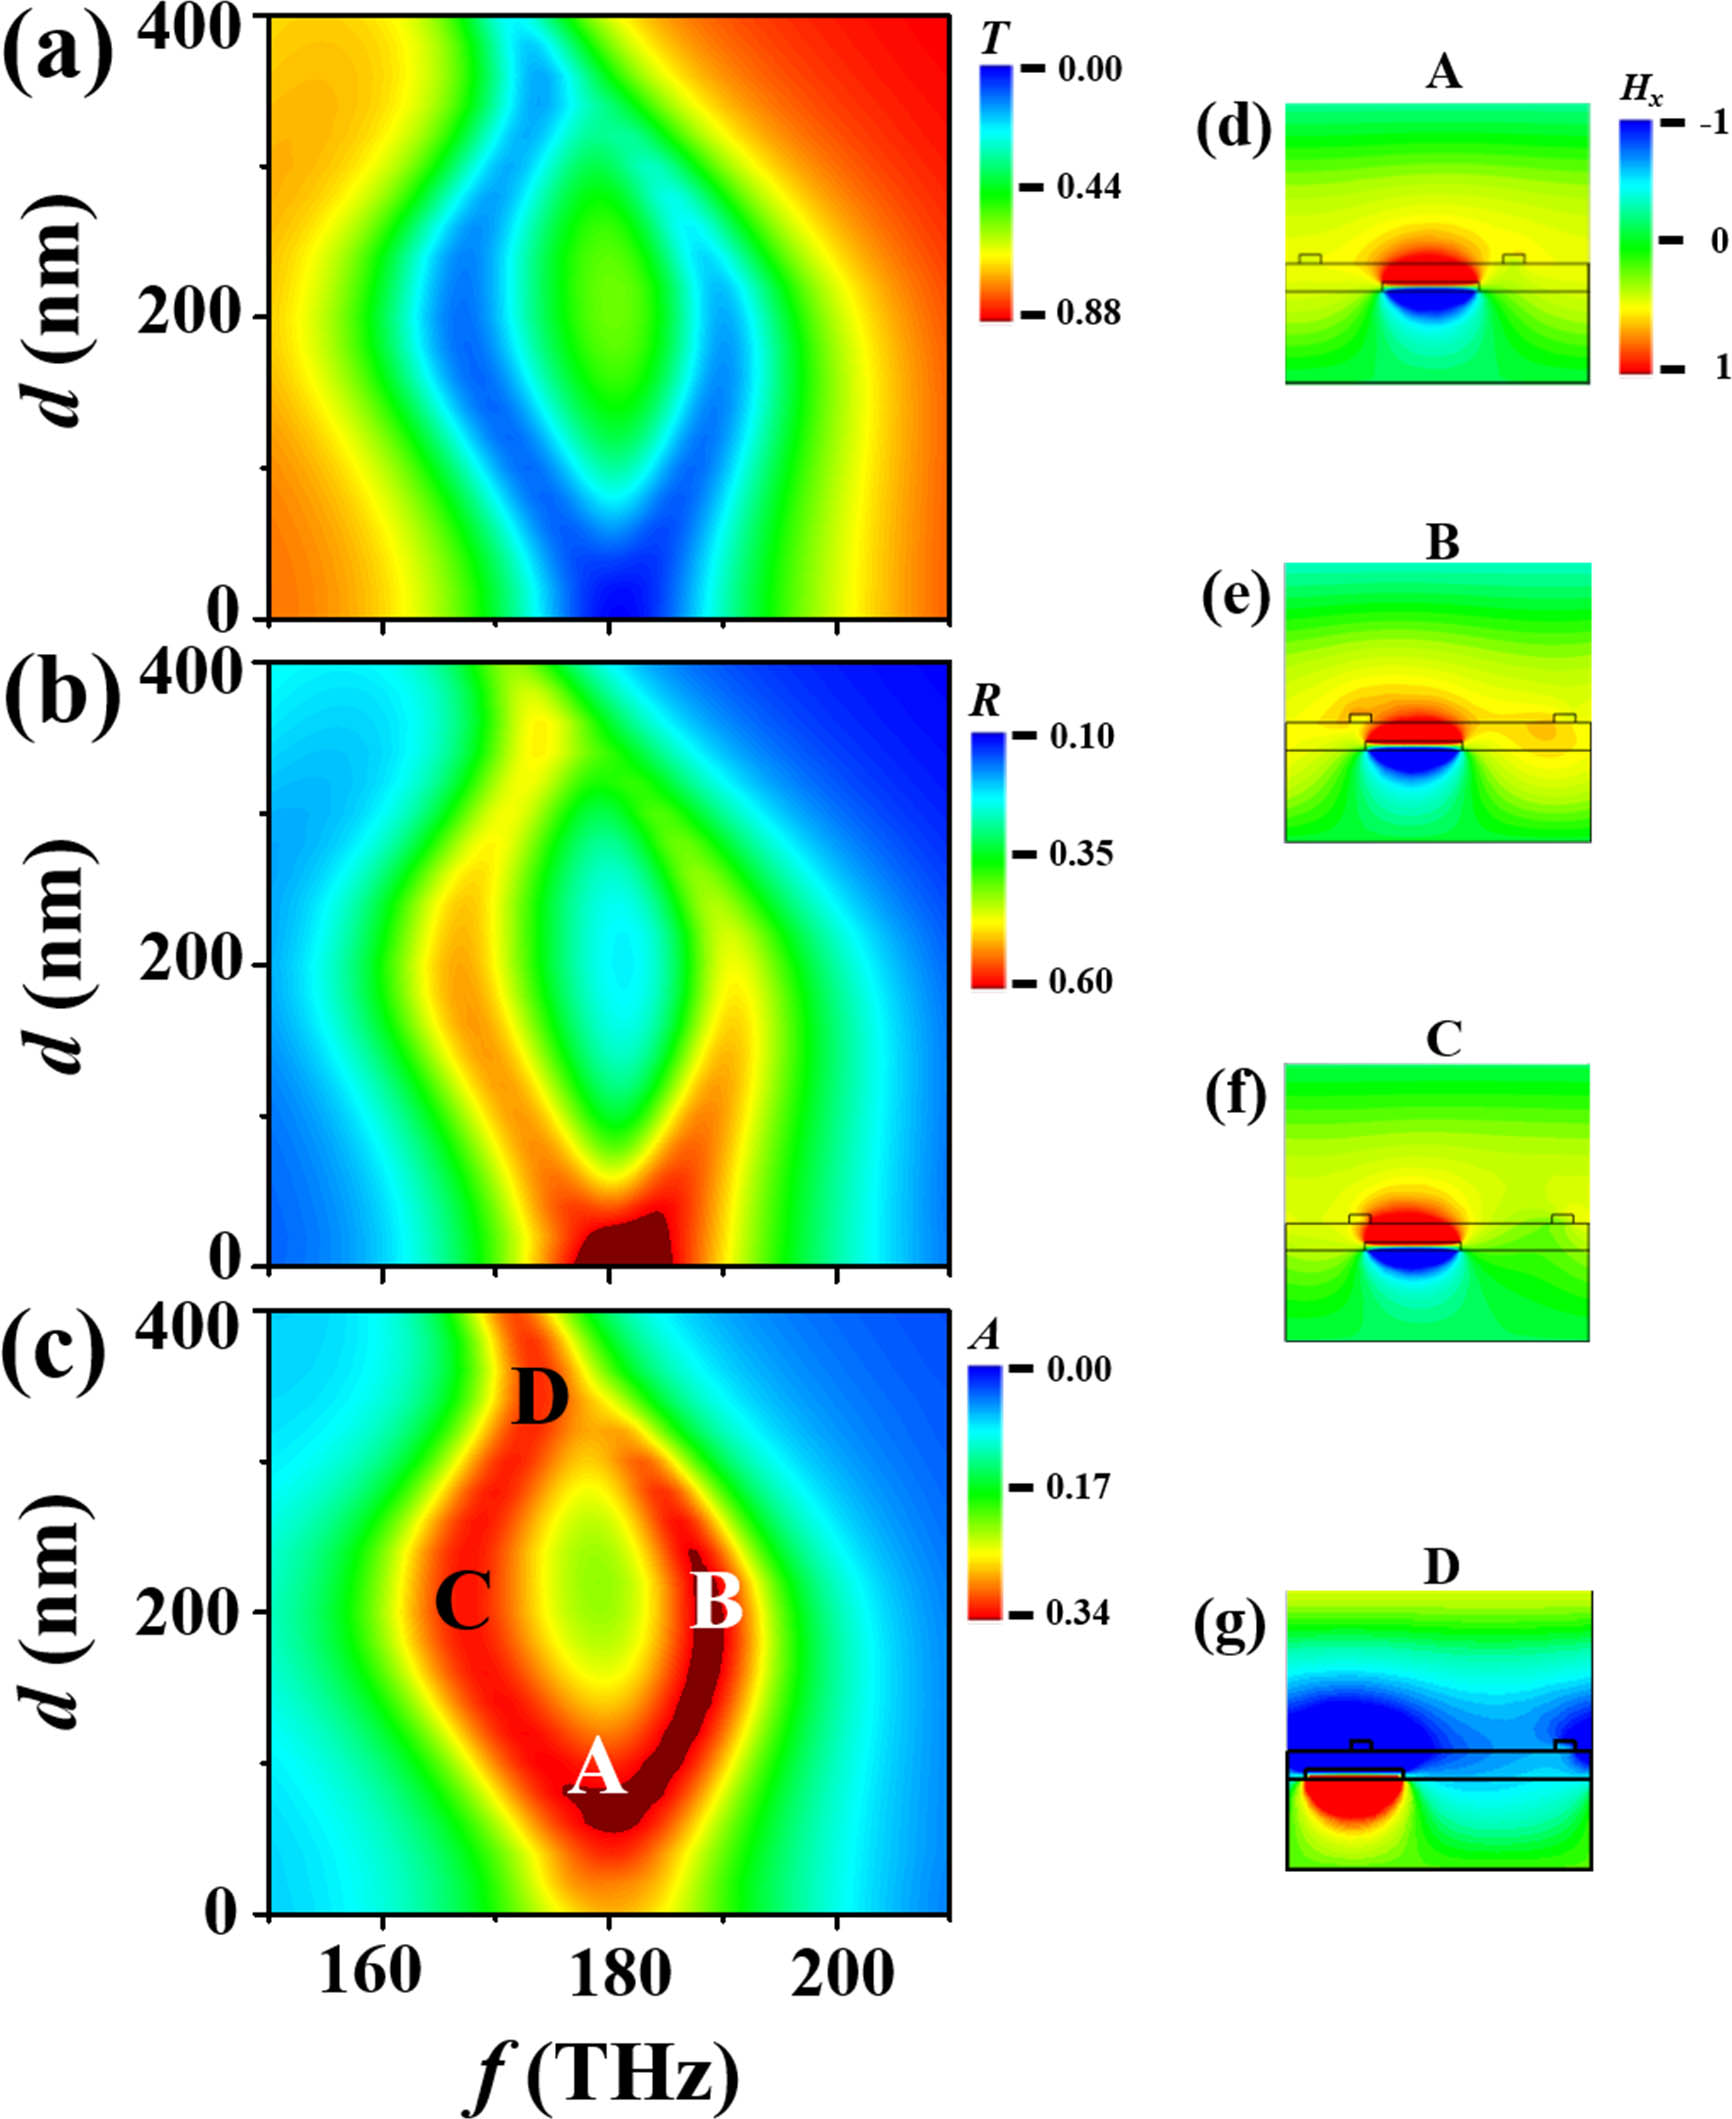
    Fig. 2. Simulated (a) zeroth-order transmittance spectra, (b) reflection spectra, and (c) absorption spectra as a function of asymmetric degree d. (d)–(g) Simulated Re(Hz) patterns of the nanostructure corresponding to the absorption peak A, peak B, peak C, and peak D, respectively. (d) Simulated Re(Hz) patterns of the nanostructure with d = 60 nm at frequency fA = 180.4 THz. (e), (f) Simulated Re(Hz) patterns of the nanostructure with d = 180 nm at frequency fB = 189.1 THz and fC = 167.2 THz, respectively. (g) Simulated Re(Hz) patterns of the nanostructure with d = 360 nm at frequency fD = 173.7 THz.
    Simulated dispersion of the nanostructure with d = 0 nm (a)–(c), d = 180 nm (d)–(f), and d = 420 nm (g)–(i).
    Fig. 3. Simulated dispersion of the nanostructure with d = 0 nm (a)–(c), d = 180 nm (d)–(f), and d = 420 nm (g)–(i).
    Simulated (a) [or (d)] zeroth-order transmittance spectra, (b) [or (e)] reflection spectra, and (c) [or (f)] absorption spectra of the nanostructures with d = 60 nm (or d = 355 nm) as a function of P.
    Fig. 4. Simulated (a) [or (d)] zeroth-order transmittance spectra, (b) [or (e)] reflection spectra, and (c) [or (f)] absorption spectra of the nanostructures with d = 60 nm (or d = 355 nm) as a function of P.
    Simulated (a) zeroth-order transmittance spectra and (b) reflection spectra of the nanostructures with d = 355 nm as a function of P. (c)–(f) Simulated Re(Hz) patterns of the nanostructure corresponding to the reflection peak E, peak F, peak G, and peak H, respectively. (c), (d) [or (e), (f)] Simulated Re(Hz) patterns of the nanostructure with P = 1160 nm (or P = 920 nm) at wavelength λE = 1.72 µm and λF = 1.79 µm (or λG = 1.63 µm and λH = 1.73 µm), respectively.
    Fig. 5. Simulated (a) zeroth-order transmittance spectra and (b) reflection spectra of the nanostructures with d = 355 nm as a function of P. (c)–(f) Simulated Re(Hz) patterns of the nanostructure corresponding to the reflection peak E, peak F, peak G, and peak H, respectively. (c), (d) [or (e), (f)] Simulated Re(Hz) patterns of the nanostructure with P = 1160 nm (or P = 920 nm) at wavelength λE = 1.72 µm and λF = 1.79  µm (or λG = 1.63 µm and λH = 1.73 µm), respectively.
    CMT modelling of the bright-dark coupled resonators. FDTD-simulated (red circles) and CMT-fitted (blue solid curves) transmission spectra for samples with different d values of (a) 0 nm, (b) 40 nm, (c) 140 nm, (d) 260 nm, (e) 300 nm, and (f) 380 nm.
    Fig. 6. CMT modelling of the bright-dark coupled resonators. FDTD-simulated (red circles) and CMT-fitted (blue solid curves) transmission spectra for samples with different d values of (a) 0 nm, (b) 40 nm, (c) 140 nm, (d) 260 nm, (e) 300 nm, and (f) 380 nm.
    Retrieved CMT parameters as functions of d.
    Fig. 7. Retrieved CMT parameters as functions of d.
    Retrieved (a), (c), (e) conventional and (b), (d), (f) generalized CMT parameters as functions of d.
    Fig. 8. Retrieved (a), (c), (e) conventional and (b), (d), (f) generalized CMT parameters as functions of d.
    Based on Eqs. (41)–(43), retrieved α (a) and Imcκ (b) as functions of d.
    Fig. 9. Based on Eqs. (41)–(43), retrieved α (a) and Im (b) as functions of d.
    Wanxia Huang, Yabo Zhang, Yuan Pei, Maosheng Wang, Fenghua Shi, Kuanguo Li. Effects of propagation phase on the coupling of plasmonic optical modes[J]. Chinese Optics Letters, 2023, 21(1): 010003
    Download Citation