
Yifeng Hou, Chang Ding, Hai Liu, Mandal Mrinal, Xingyu Gao, Zhendong Luo, Ziku Wu. Enhancement and Recognition of Infrared Target with Low Quality Under Backlight Maritime Condition[J]. Acta Optica Sinica, 2023, 43(6): 0612003
- Acta Optica Sinica
- Vol. 43, Issue 6, 0612003 (2023)
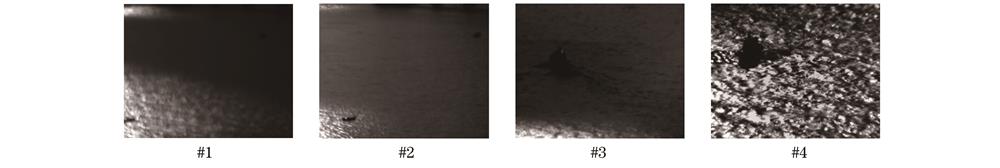
Fig. 1. Infrared maritime images under backlight condition
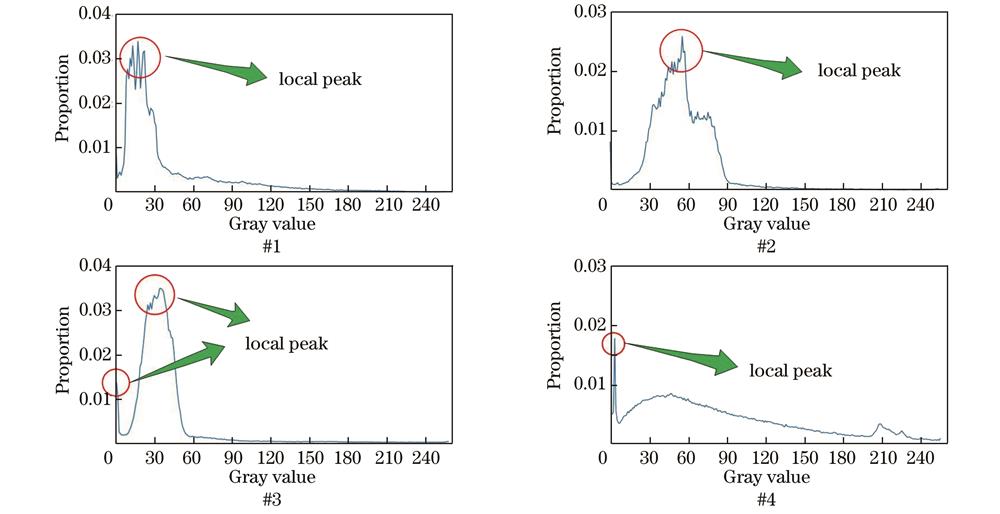
Fig. 2. Histograms of sub-images in Fig. 1
Fig. 3. Target detection results under different maritime conditions using classical LCM. (a) Target detection result under backlight condition with ω1=9 and k=3; (b) target detection result under backlight condition with ω1=27 and k=3; (c) target detection result under heavy wave interference with ω1=7 and k=3; (d) target detection result under heavy fog with ω1=9 and k=3
Fig. 4. Schematic diagram of original histogram modification
Fig. 5. Results of new histogram equalization
Fig. 6. Structural element in filter and edge information after amplification. (a) Structural element in filter; (b) result of edge information of #1 in Fig.1 amplified by 10 times; (c) result of edge information of #3 in Fig.1 amplified by 10 times
Fig. 7. Flowchart of HEPLEF algorithm
Fig. 8. Enhancement results of HEPLEF algorithm. (a) Entire result and local target region of #1 in Fig.1; (b) enhancement result and local target region of #1 in Fig.1; (c) entire result and local target region of #3 in Fig.1; (d) enhancement result and local target region of #3 in Fig.1
Fig. 9. Comparison of enhancement results before and after edge information fusion. (a) After edge information fusion; (b) before edge information fusion
Fig. 10. Enhancement result of #4 in Fig. 1 by HEPLEF algorithm. (a) Original image; (b) enhancement result
Fig. 11. Principle for target detection based on local contrast saliency and minimum target detection unit under single scale. (a) Principle for target detection based on local contrast saliency; (b) minimum target detection unit under single scale
Fig. 12. Schematic diagram of target detection unit with multiple scale
Fig. 13. Pseudocode of LCMMBC algorithm
Fig. 14. Schematic diagram of target detection result and local contrast saliency by LCMMBC algorithm. (a) Schematic diagram of target detection result; (b) schematic diagram of local contrast saliency
Fig. 15. Comparison of enhancement results for #1 in Fig. 1 obtained by different algorithms. (a) Classical histogram equalization algorithm; (b) MMBEBHE algorithm; (c) ETHE algorithm (Tthreshold=5); (d) Retinex algorithm (k=7)
Fig. 16. Comparison of enhancement results for #3 in Fig. 1 obtained by different algorithms. (a) Classical histogram equalization algorithm; (b) MMBEBHE algorithm; (c) ETHE algorithm (Tthreshold=5); (d) Retinex algorithm (k=7)
Fig. 17. Target recognition result and three-dimensional diagram of local contrast saliency for #1 in Fig. 1 with w1=9 and k=2.(a) Target recognition result; (b) three-dimensional diagram of local contrast saliency
Fig. 18. Target recognition result and three-dimensional diagram of local contrast saliency for enhancement result of #1 in Fig. 1 with w1=9 and k=2. (a) Target recognition result; (b) three-dimensional diagram of local contrast saliency
|
Table 1. AG of original image and enhancement algorithms
|
Table 2. Comparison of LCG of different enhancement algorithms
|
Table 3. Comparison of target detection rates and target false alarm rates between different algorithms unit: %

Set citation alerts for the article
Please enter your email address
© Copyright 2018-2021 | Chinese Laser Press. All Rights Reserved 沪ICP备15018463号-20