• Laser & Optoelectronics Progress
  • Vol. 58, Issue 3, 3060031 (2021)
Li Hao, Wei Yongfeng*, Ji Yushuang, and Li Xiang
Author Affiliations
  • College of Electronic Information Engineering, Inner Mongolia University, Hohhot, Inner Inner Mongolia, 010021, China
  • show less
    DOI: 10.3788/LOP202158.0306003 Cite this Article Set citation alerts
    Li Hao, Wei Yongfeng, Ji Yushuang, Li Xiang. Generation and Dechirping of Linear Frequency Modulation Signals[J]. Laser & Optoelectronics Progress, 2021, 58(3): 3060031 Copy Citation Text show less
    Schematic of proposed LFM signals and de-chirp generation scheme
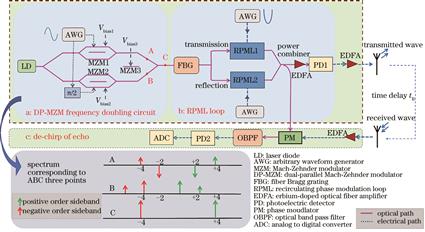
    Fig. 1. Schematic of proposed LFM signals and de-chirp generation scheme
    Schematic of RPML
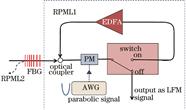
    Fig. 2. Schematic of RPML
    Time-frequency characteristics of transmitting and receiving waves
    Fig. 3. Time-frequency characteristics of transmitting and receiving waves
    Output signal spectrum of DPMZM
    Fig. 4. Output signal spectrum of DPMZM
    Parabolic signal
    Fig. 5. Parabolic signal
    ±4-order sideband
    Fig. 6. ±4-order sideband
    Time domain diagram of LFM signal output by PD after 20 cycles
    Fig. 7. Time domain diagram of LFM signal output by PD after 20 cycles
    LFM signal after 20 cycles. (a) Spectrum; (b) time-frequency diagram
    Fig. 8. LFM signal after 20 cycles. (a) Spectrum; (b) time-frequency diagram
    LFM signals with different center frequencies. (a) Spectrum; (b) time-frequency diagram
    Fig. 9. LFM signals with different center frequencies. (a) Spectrum; (b) time-frequency diagram
    Spectrum and time-frequency diagram of LFM signal after 30 cycles. (a) Spectrum; (b) time-frequency diagram
    Fig. 10. Spectrum and time-frequency diagram of LFM signal after 30 cycles. (a) Spectrum; (b) time-frequency diagram
    Signal with time width of 20 ns. (a) Parabolic signal; (b) spectrum; (c) time-frequency diagram
    Fig. 11. Signal with time width of 20 ns. (a) Parabolic signal; (b) spectrum; (c) time-frequency diagram
    Signal with larger amplitude. (a) Parabolic signal; (b) spectrum; (c) time-frequency diagram
    Fig. 12. Signal with larger amplitude. (a) Parabolic signal; (b) spectrum; (c) time-frequency diagram
    Phase coded signal. (a) Parabolic signal; (b) spectrum; (c) time-frequency diagram
    Fig. 13. Phase coded signal. (a) Parabolic signal; (b) spectrum; (c) time-frequency diagram
    Autocorrelation results of LFM. (a) After 20 cycles; (b) after 30 cycles
    Fig. 14. Autocorrelation results of LFM. (a) After 20 cycles; (b) after 30 cycles
    Optical spectrum after phase modulation
    Fig. 15. Optical spectrum after phase modulation
    RF spectrum after beat frequency processing
    Fig. 16. RF spectrum after beat frequency processing
    Single frequency signal obtained by de-chirping echo signal with different time delay
    Fig. 17. Single frequency signal obtained by de-chirping echo signal with different time delay
    LFM signal after 50 cycles. (a) Time domain diagram; (b) spectrum
    Fig. 18. LFM signal after 50 cycles. (a) Time domain diagram; (b) spectrum
    Different parabolic signalBandwidthTimeTime-bandwidth productChirp rate
    Normalized parabolic signalBTBTa
    N times of cycles1.6 NBT1.6 NBTNa
    N-times signal time widthB/NNTBTa/N2
    N-times signal amplitudeNBTNBTNa
    N-bit phase encodingBNTNBTa
    N-times time width and M-times amplitude(M/N)BNTMBTMa/N2
    N-times amplitude and M-bit phase codingNBMTNMBTNa
    Table 1. Effect of different parabolic signals on bandwidth, time-bandwidth product and chirp rate
    Li Hao, Wei Yongfeng, Ji Yushuang, Li Xiang. Generation and Dechirping of Linear Frequency Modulation Signals[J]. Laser & Optoelectronics Progress, 2021, 58(3): 3060031
    Download Citation