
Peng Hu, Jianzhu Zhang. Analysis of Spatio-Temporal Characters of Thermal Effects of Optical Components in Laser System[J]. Acta Optica Sinica, 2020, 40(20): 2014001
- Acta Optica Sinica
- Vol. 40, Issue 20, 2014001 (2020)
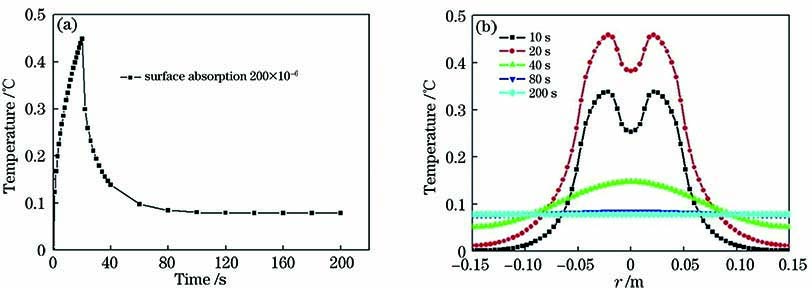
Fig. 1. Temperature increase distribution of Si reflective mirror. (a) Maximal temperature increase change with time; (b) radial distribution of surface temperature increase
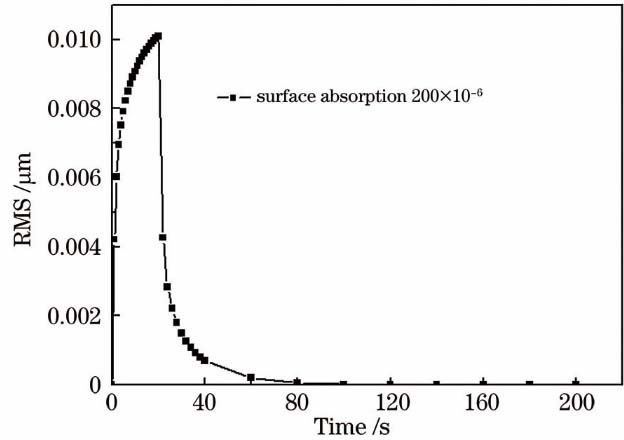
Fig. 2. RMS of thermal aberration of Si reflective mirror change with time
Fig. 3. Temperature increase distribution of SiO2 window mirror at different moments. (a) Face absorption; (b) body absorption
Fig. 4. Thermal effect of SiO2 window mirror change with time. (a) Maximal temperature increase; (b) RMS of thermal aberration
Fig. 5. Adaptive correction simulation optical path of thermal effect. (a) Reflective mirrors Si; (b) window mirror SiO2
Fig. 6. RMS of thermal aberration under uniform intensity laser irradiation change with time
Fig. 7. Normalized peak intensity of far-field under uniform laser irradiation change with time. (a) AO open; (b) AO closed
Fig. 8. Laser intensity distribution in experiment
Fig. 9. Distribution of thermal aberration at 20 s. (a) Reflective mirrors Si; (b) window mirror SiO2
Fig. 10. RMS of thermal aberration under experimental laser irradiation change with time
Fig. 11. Normalized peak intensity of far-field under experimental laser irradiation change with time before and after correction. (a) AO open; (b) AO closed
|
Table 1. Physical parameters of the materials

Set citation alerts for the article
Please enter your email address
© Copyright 2018-2021 | Chinese Laser Press. All Rights Reserved 沪ICP备15018463号-20