Ultra-high quality () whispering gallery mode (WGM) microtoroid optical resonators have demonstrated highly sensitive biomolecular detection down to the single molecule limit; however, the lack of a robust coupling method has prevented their widespread adoption outside the laboratory. We demonstrate through simulation that a phased array of nanorods can enable free-space coupling of light both into and out of a microtoroid while maintaining a high . To simulate large nanostructured WGM resonators, we developed a new approach known as FloWBEM, which is an efficient and compact 3D wedge model with custom boundary conditions that accurately simulate the resonant Fano interference between the traveling WGM waves and a nanorod array. Depending on the excitation conditions, we find loaded factors of the driven system as high as and signal-to-background ratios as high as 3.86%, greater than the noise levels of many commercial detectors. These results can drive future experimental implementation.
1. INTRODUCTION
Ultra-high-quality () factor whispering gallery mode (WGM) optical resonators such as microtoroids and spheres have demonstrated sensitive biomolecular detection down to the single molecule level. To enable widespread use of these devices outside the laboratory and to enable portable point of care systems, robust light coupling strategies are needed [1]. Most often, light is evanescently coupled into a microtoroid optical resonator using optical fibers that have been tapered to hundreds of nanometers in diameter [2]. These tapers, however, are fragile, sensitive to environmental vibrations such as fluid flow fluctuations, and require precise alignment to phase match with the WGM with high efficiency [3–6]. Other coupling approaches include prism coupling, direct illumination from embedded light emitters in a resonator, angled fiber illumination, and polished half-block couplers, but these methods suffer from either degradation due to poor coupling or difficulty in maintaining robust coupling to on-chip WGM resonators [7]. An efficient and high free-space coupling scheme is chaos-assisted momentum transformation, which can couple free-space light into deformed, nonrotationally-symmetric microresonators without external couplers [8–13]. This method is broadband and free from a phase-match condition as a result of its pump-induced nonresonant dynamical tunneling nature [8–10]. However, the spectra and mode field distribution are irregular in these devices, which can limit their use in applications such as frequency comb generation or evanescent biosensing, where a predictable and regular response is advantageous. Previously, randomly positioned polystyrene nanospheres on the microtoroid surface have been used for incoupling of light [14]; however, tapered fibers were still used to couple the light out of the microtoroid. Furthermore, the random positioning of these particles prevented efficient coupling. Finally, individual nanoscale scatterers placed on the surface of microspheres have been used in conjunction with nanopositioners in laboratory settings to couple in free-space light with a high coupling efficiency of 16.8% [15,16]. However, this method relied on using the microsphere itself as a ball lens for focusing the light onto the scatterer, which would not work for microtoroid-shaped resonators.
Precisely positioned photonic nanostructures have the potential to alleviate these problems through their unique ability to trap and direct light scattering via surface plasmon resonances (SPRs), antenna resonances [17], and/or grating resonances [18]. The design of efficient coupling structures can be accomplished by full three-dimensional (3D) finite-element method simulations of smaller (lower-) nanostructure-microresonator hybrid systems [8,19]. For example, in Ref. [8], a 12 μm major radius and 2 μm minor radius microtoroid is simulated, which is significantly smaller in volume than the microtoroid simulated here, which has major radius and minor radius . These toroid dimensions and an operating wavelength near 633 nm are chosen to match previous experiments [2,20]. Conventional 3D simulations remain intractable for such large high- WGM microresonators. For WGM resonators with complete azimuthal symmetry (e.g., bare microtoroids), a 2D axisymmetric simulation method is often used, while for resonators with axial translation symmetry, such as cylindrical microcapillaries [21], a planar 2D simulation can be used, but neither approach can simulate isolated nanoparticles on a resonator surface.
Previously, eigenfrequency analysis was used to simulate a thin 3D wedge of a microresonator coupled to nanoparticles with perfect electrical/magnetic conductor boundary conditions and perfectly matched layers [22,23]. While these simulations provided some insight, they do not accurately model typical traveling-wave WGM experiments, because the perfect conductor boundary conditions can only simulate standing waves. When the WGM is a traveling wave, a nanoparticle would experience the same time-average field intensity regardless of its azimuthal coordinate on the resonator, while in the case of a standing wave, the nanoparticle experiences significantly different fields depending on whether it is located at a node, an antinode, or somewhere in-between. As a result, it is unlikely that standing-mode simulations would accurately predict the interaction between a traveling wave WGM and plasmonic nanostructures, a case which is common in biosensing experiments [23].
Sign up for Photonics Research TOC. Get the latest issue of Photonics Research delivered right to you!Sign up now
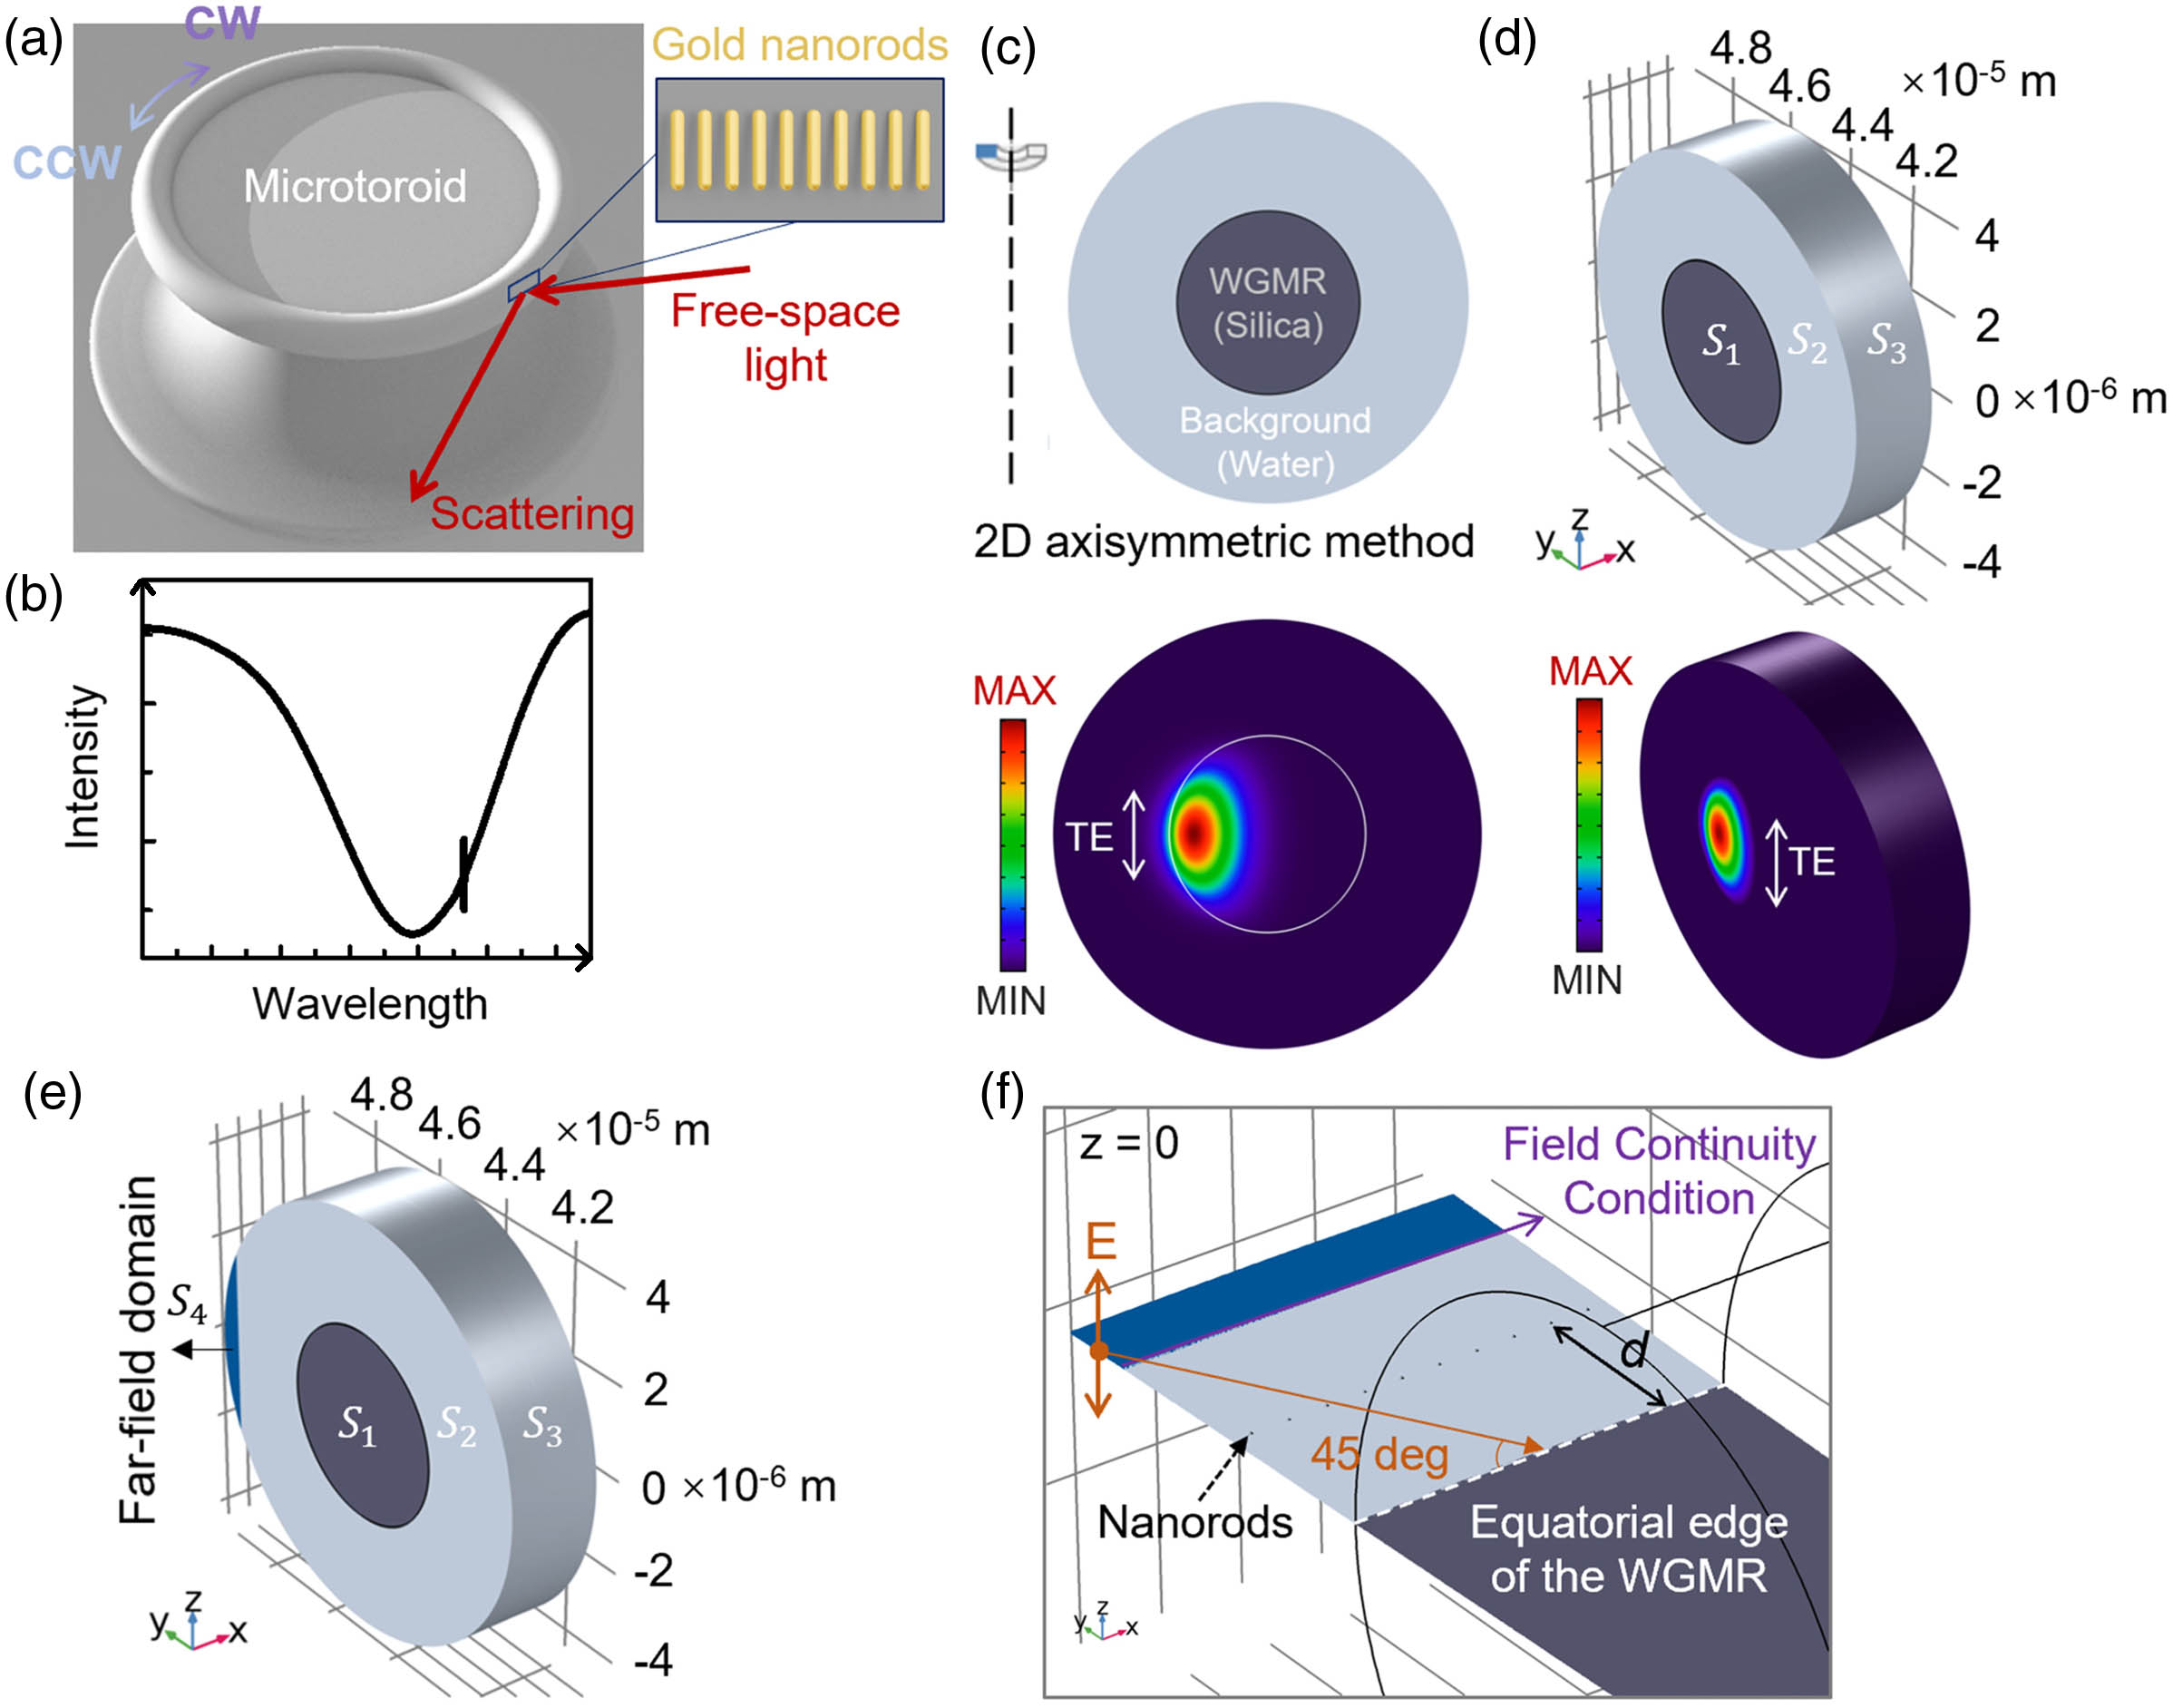
Here we design a gold nanorod (NR) grating as an experimentally feasible alternative for robust coupling of free-space light to a microtoroid resonator [Fig. 1(a)], and numerically demonstrate a compact and computationally efficient 3D model that simulates the performance of the driven system. The WGM backaction-mediated reflection spectrum is characterized by a Fano-like optical interference between the WGM and the plasmonic grating resonance [Fig. 1(b)]. All simulations are carried out using the software package COMSOL Multiphysics (wave optics module).
Figure 1.Free-space coupling to a WGM microtoroid optical resonator via a phased array of gold nanorods. (a) Schematic view. (b) Collection of far-field scattering from the grating shows the Fano resonance corresponding to the interference between the grating and WGM resonances. (c) Established 2D axisymmetric simulations identify a resonance of the bare WGM at , corresponding to an azimuthal mode number . (d) The FloWBEM simulation of the same bare toroid as in panel (c). Surfaces and are simulated with Floquet boundary conditions, and is simulated with scattering boundary conditions. (e) For simulating the driven system, a far-field domain () is added at the circumference, replacing the Floquet and scattering boundary conditions for that region. (f) Nanorods are placed in the equatorial plane, between the light source, which is incident at 45°, and the silica toroid. A field continuity condition is applied between the light source and the domain surrounding the toroid.
We are able to simulate the large microtoroid in 3D by simulating a small (five wavelengths in arclength) wedge using periodic Floquet-wedge boundary conditions (see Appendix B for detailed methods descriptions) with a beam envelope method solver, a method we call FloWBEM. The beam envelope method (not to be confused with the beam propagation method [24]) has been previously used to simulate ring resonators in 2D [25] but to the best of our knowledge has never been used to simulate a 3D WGM. In FloWBEM, the Floquet boundary conditions are applied to the faces of the wedge, except for a small far-field port at the outer circumference of the domain when simulating externally driven systems [Figs. 1(d) and 1(e)]. In this way, the Floquet boundary conditions are applied to the toroid and its surrounding evanescent zone. The remaining outer surface of the wedge uses scattering boundary conditions. This approach allows the simulation to accurately capture the periodic nature of the wedge to form a toroid structure without imposing mirror boundary conditions, which prevent simulation of traveling waves.
To validate the FloWBEM approach, we first compare it to the established 2D axisymmetric model of a bare toroid [26] [Figs. 1(c) and 1(d)]. Both models are run using an eigenfrequency solver, which finds the normal modes of the system without considering any specific type of excitation. As expected, both simulations show the same mode field pattern and exhibit similar ( using a 2D axisymmetric simulation and using FloWBEM). Following previous approaches [14], we assume an imaginary part of the refractive index equal to to limit the factor to values similar to what is seen in experiments.
3. RESULTS AND DISCUSSION
Using an external light source to drive the system and a linear array of nanorods acting as a grating, we find that it is possible to couple from the far-field into a high- WGM (Fig. 2). We choose a grating periodicity () that provides partial phase-matching (see Appendix B Fig. 7) between the incident light and the WGM to study the simultaneous excitation of degenerate clockwise (CW) and counterclockwise (CCW) modes. In the grating, the nine individual nanorods are modeled as nanocylinders with a length-to-diameter aspect ratio of 1.87 and a radius of 5 nm. Our simulation results show that the two modes remain uncoupled due to the lack of any major perturbations (internal defects, quantum emitters, etc.) that would lift the degeneracy [27–30]. Mode splitting due to a lifted degeneracy becomes sizeable only if the frequency splitting is larger than the linewidth of the WGM resonance [29]. Here, we find that is not the case and coupling the grating to the WGM results in only a frequency shift and broadening of the linewidth (see Appendix B Fig. 8) [31].
Figure 2.Frequency domain simulations of the driven system. (a) Intracavity energy of the coupled TE WGM with a grating spaced from the toroid. Zoom-in: . (b) Intracavity energy of the coupled TM WGM with a grating-toroid spacing . Zoom-in: . (c) TE WGM backaction-mediated reflection spectrum corresponding to the same simulation as panel (a). (d) TM WGM backaction mediated reflection spectrum corresponding to the same simulation as panel (b). In all panels, the wavelength step is 0.5 nm for the broad spectrum, and between 0.005 pm and 2 pm in the vicinity of the resonance (insets). The SBR and values for panels (c) and (d) are given in Table 1.
From a series of frequency-domain simulations, the resonance of the driven system can be identified and characterized by the energy stored in the resonator as a function of wavelength [Figs. 2(a) and 2(b)]. Owing to the perturbation induced by the grating on the WGM, the TE resonance shifts slightly from for a bare resonator to in the coupled system (see Appendix C). The loaded of this driven TE mode is , which is only degraded by approximately 1 order of magnitude relative to the intrinsic of the bare toroid due to the scattering and absorption by the grating. Because we have specified a particular azimuthal mode number through our Floquet boundary conditions, we find only a single resonance despite the free spectral range of order 1 nm for a microtoroid of this size. Other resonances can be identified by selecting a different . As a result, we expect the spectrum to be accurate only within a small neighborhood of the resonance and not over the full background. As a validation of our simulation approach, we find very similar loaded factors by performing eigenfrequency simulations of the coupled grating-toroid system, where is evaluated as and is the complex eigenfrequency (Table 1). The advantage of eigenfrequency simulations is that they can be run significantly faster than a series of frequency domain simulations.
Driven TE
Driven TM
Coupling distance d
1000 nm
700 nm
1000 nm
700 nm
Frequency domain driven Q (λres/ΔλFWHM)
4.53×10⁶
6.34×10⁶
2.88×10⁶
2.10×10⁷
Eigenfrequency coupled Q(Re{fres}2Im{fres})
4.59×10⁶
6.04×10⁶
2.91×10⁶
1.80×10⁷
Reflected spectrum linewidth (δλFWHM)
0.16 pm
0.1 pm
0.28 pm
0.04 pm
SBR (from reflected spectrum)
3.86%
0.05%
1.33%
1.18%
Normalized intracavity energy (W/I0)
9.77×10⁻²³m2·s
4.36×10⁻²³m2·s
3.81×10⁻²³m2·s
2.60×10⁻²²m2·s
Table 1. Calculation Methods for Loaded of the Driven WGM Coupled to a Gratinga
In an experiment, it would be difficult to measure the intracavity energy, and instead one would track the resonance by measuring the power reflected (scattered) by the grating coupler [Figs. 2(c) and 2(d)]. Mediated by the WGM backaction, the reflection is characterized by a Fano lineshape due to the interference of the ultra-narrow WGM resonance with the broadband plasmonic grating resonance, corresponding to a radiative continuum of states. In general, Fano lineshapes result from the coherent interference between narrow and broad spectral features [32]. The different lineshapes in Figs. 2(c), 2(d), 5, and 6 are commonly encountered in Fano interference and are due to differences in phase between the WGM and plasmonic grating resonance [33–36]. To track any resonant shifts with the greatest precision during sensing experiments, it is important that the linewidth should be narrow and the line amplitude be easily detectable above the background. The polarization of the light and the spacing between the grating and toroid influence the reflected spectrum linewidth and signal-to-background ratio (SBR). As shown in Figs. 2(c) and 2(d) and Table 1, we can achieve ultra-narrow linewidths while maintaining SBR levels of the order of 1%, which is greater than the noise levels of many commercial detectors. In Table 1, we also report the intracavity energy normalized by the intensity of the incident plane wave, where is the input optical power through the input side surface of the far-field domain [see Fig. 1(e)], which has an area of .
The distance between the grating and the toroid also impacts the loaded (Fig. 3) and stored energy in the cavity (Appendix B Table 2). Experimentally, different grating-toroid spacings could be obtained by mounting the nanoparticles on a flat transparent substrate that is independently positioned [36], by constructing a scaffold out of a dielectric material with a relatively low refractive index [37] or by using nanoparticles that are coated with a dielectric shell [38]. In general, a stronger coupling at shorter distances between the grating and WGM decreases the loaded due to increased scattering and absorption losses. However, we also find a peak in loaded at , due to strong destructive interference between the incident light scattered by the grating and the circulating WGM light also scattered by the grating (see Appendix A Figs. 5 and 6). As a further validation of our system, we see good agreement in Fig. 3 for three different methods of calculating : the previously discussed driven-system frequency-domain and eigenfrequency , as well as another method: eigenfrequency , where is the intracavity energy and the total power loss [39].
Figure 3.Effect of grating-WGM separation on linewidths. Loaded factors for both TE and TM polarizations depend on grating-toroid separation. factors are evaluated using three methods: eigenfrequency (solid circles and lines), eigenfrequency (hollow circles), and frequency domain (red stars). Owing to the increased computational costs of frequency domain simulations, only four points are shown.
The FloWBEM approach enables visualization of the magnitudes of the traveling-mode WGM fields. In the systems presented here, the CCW mode [Figs. 4(a) and 4(b)] is preferentially excited due to the partial phase matching of the component of the incident light wavevector, the grating period, and the WGM wavenumber (see Appendix B Fig. 7 and Appendix B Table 2). The CW mode [Fig. 4(c)] is also excited at the same wavelength (see Appendix B Fig. 8) but with a lower amplitude than the CCW mode. Thus, the net electric field within the toroid consists of a partially traveling/partially standing mode, manifested by the ripples seen in Fig. 4(d). The ripples could be reduced and a purer traveling mode excited by fine-tuning the phase matching of the grating to account for the precise distance between the grating and toroid mode, by shaping or tapering the grating to further promote a particular mode direction [40] and/or by increasing the number of nanorods in the grating to minimize backward scattering due to edge effects.
Figure 4.Mode field distributions of the driven coupled system. (a) 3D frequency domain simulation of the microtoroid coupled to the grating with various separation distances. The CCW mode is shown, which is selected through appropriate choice of the Floquet boundary conditions. The incident light is -polarized, which drives a TE WGM. Field distributions are plotted as field amplitude . (b) Same as panel (a), but with a separation of . (c) Same as panel (b), but where the CW solution has been selected through the choice of Floquet boundary conditions with opposite sign. (d) The superposition of the field distributions in (b) and (c).
In summary, a major barrier to widespread commercialization of microtoroid resonator sensors is the need for evanescent light coupling using fragile fiber tapers. As an alternative to these fragile tapers, we designed a gold NR grating that eliminates the tapered optical fiber, while maintaining a high factor and sufficient SBR ratio. Ultimately, these designs could be fabricated using pick-and-place nanomanufacturing approaches or through directed self-assembly [41,42]. Simulations of this structure were made possible by a novel finite-element 3D beam-envelope model with custom boundary conditions called FloWBEM that can model interactions among traveling waves within the microtoroid, nanostructures on its surface, and far-field radiation. Both eigenfrequency and frequency-domain solvers are reliable in studying the driven system. Frequency-sweep simulations run slower than eigenfrequency simulations but allow the Fano optical response to be determined. We anticipate that our proposed modeling approach can solve a variety of other nanostructure-microcavity coupled systems in the future, including single-photon resonator-atom interactions [43,44].
Acknowledgment
Acknowledgment. This project was supported by the Defense Threat Reduction Agency-Joint Science and Technology Office for Chemical and Biological Defense (Grant #HDTRA11810044). L. C. is supported by the National Key R&D Program of China, NSFC, Natural Science Foundation of Beijing, CSC Foundation, and Beijing University of Posts and Telecommunications Excellent Ph.D. Students Foundation. C. L. is supported by a DeMund Foundation Graduate Student Endowed Scholarship in Optical and Medical Sciences and a Friends of Tucson Optics (FOTO) Scholarship from the University of Arizona. L. C. designed and performed the simulations. C. L. assisted with the simulations. E. M. and J. S. conceived the idea and supervised the project. All authors (L. C., C. L., Y. L., J. S., and E. M.) analyzed the data, discussed the results, and wrote the paper. This material is based upon High Performance Computing (HPC) resources supported by the University of Arizona TRIF, UITS, and RDI and maintained by the UA Research Technologies department.
APPENDIX A: FIGURES FOR TABLE?1
Figure 5.Reflected spectrum exhibiting a Lorentzian lineshape, corresponding to the third column in Table 1 of the main text (). The SBR is 0.05%.
In all simulations, the refractive indices of the various materials are for the silica toroid, and for the water background; the optical parameters of the gold are described by an interpolation function from the COMSOL Material Library [45].
2D Axisymmetric Method Simulations
2D axisymmetric simulations of the bare toroid are used to validate the 3D FloWBEM simulations [26]. In these simulations, the microtoroid has a major (minor) radius (). The thickness of the simulated background water domain is in the minor radial direction, which is large enough to ignore the performance difference between the perfectly matched layers (PMLs) and scattering boundary condition in terms of absorbing and scattering. Simulation results show that WGM eigenmodes can be accurately simulated using either PMLs or scattering boundary conditions. The angular dependence of the electric field is given by , where is an azimuthal mode number of 660 for the WGM resonance . There are two degenerate traveling wave modes with the same field distribution and resonance frequency, corresponding to clockwise (CW) and counterclockwise (CCW) propagation.
3D FloWBEM Bare Toroid Simulations
A 3D eigenfrequency analysis using the electromagnetic wave beam-envelope method was performed to simulate a 3D wedge of the microtoroid without the plasmonic nanorod grating. In the simulation, the whole microtoroid is reduced to a wedge using periodic Floquet boundary conditions, and the large water background is truncated using scattering boundary conditions as illustrated in Fig. 1 of the main text. The geometry of the circular simulated cross section is the same as in the 2D axisymmetric model. The wedge has an azimuthal angle of radians, where . All domains are specified with a phase of zero so that the same phase definition works equally well for both CW and CCW modes. Even though this phase is not accurate for the modes in the toroid, we are using a mesh density that is greater than six cells per effective wavelength within the toroid, which is enough for the beam envelope method to recover the correct field [46]. The Floquet vector for the wedge boundary conditions is determined by where the sign corresponds to the direction of the mode that is being simulated ( for CW, for CCW). Note that COMSOL uses the Floquet vector to relate the fields ( and , which can be either electric or magnetic fields) on the two faces of the wedge:
Grating Simulations without the Microtoroid
In the grating, the nanorods are modeled as nanocylinders with a length-to-diameter aspect ratio of 1.87 and a radius of 5 nm so that the dipolar longitudinal surface plasmon resonance (LSPR) is at . The grating consists of nine nanorods spaced at . A 3D full-wave frequency domain analysis was performed for the finite gold nanorod grating in the absence of the WGM resonator. The grating is placed above a flat silica substrate at a separation of and immersed in a water background. The scattered field is solved in a domain enclosed by PMLs. The free-space light is simulated by defining a background wave type (a linearly polarized plane wave). The far-field scattering patterns of the grating for both LSPR and TSPR illustrate the coupling mechanism (Fig. 7). The reflection of the driven system gives a spectral dip at 630 nm [main text Figs. 2(c) and 2(d)], consistent with the LSPR of the nanorods.
Figure 7.Far-field scattering from isolated nanorods and nanorod arrays without a WGM resonator. (a) Intensity of the far-field scattering of a single nanorod excited at the LSPR. (b) 3D grating of 10 nanorods with nonphase matched periodicity , excited at normal incidence and at the LSPR of the individual rods. (c) Same as (b), but at 45° incidence. (d) Same as (c), but with nine nanorods with periodicity that is perfectly phase-matched for backward scattering when excited at 45° incidence. For the case of finite-length nanorods positioned near the curved surface of the toroid, we expect only partial phase matching (see main text Fig. 4) and not perfect phase matching. (e) Same as (c), but excited with transverse polarization, which would correspond to a TM-polarized WGM. (f) Same as (d), but excited with transverse polarization. The six panels are solved in frequency domain at a wavelength of 630 nm. The dark orange arrows denote the incoming angle of the light.
Figure 8.Intracavity energy spectra for the TE CCW mode (blue) and the TE CW mode (red). The CCW mode is dominant due to partial phase matching between the incident light, grating periodicity, and WGM mode.
For the 2D axisymmetric simulations of the bare microtoroid, the maximum size of the free triangular mesh is inside the microtoroid and in the surrounding water and PML, where is the effective refractive index of the WGM, which is approximately equal to the bulk refractive index of .
For 3D simulations of the bare toroid wedge, a free triangular mesh is generated on one of the faces with maximum size in the water domain and in the toroid domain. This free triangular mesh is then swept across the wedge such that the mesh cells become triangular prisms with thickness and , respectively. Because we use the beam-envelope method, only six mesh cells per “beat wavelength” are required, where the beat wavelength corresponds to the error in the prescribed phase required by the beam-envelope method and the true phase of the physical system. In our simulations, the beat wavelength equals the true wavelength as we prescribed a phase of zero. Thus, we can use a relatively coarse mesh for the cross sections of the wedge. COMSOL requires approximately 220 GB of memory to run simulations at this mesh density.
To verify that the mesh was sufficiently fine, we investigated the effects of even finer meshing. When reducing the thickness of mesh cells in the sweep direction from to , we found that the resonance wavelength for the bare TE mode with only shifted slightly from for the coarser mesh to for the finer mesh. In both cases, the remains . However, owing to the computational costs involved in running simulations at the finer mesh and the consistent results obtained with the coarser mesh, we elected to use the coarser mesh resolution described above for the bulk of our simulations.
For 3D simulations of the isolated grating, the maximum sizes of the free tetrahedral mesh for nanorod and background domains are set as and , respectively, where is the nanorod radius. The PMLs are thick and are swept with a mesh size of . For 3D simulations of the toroid wedge with a plasmonic grating, a free tetrahedral mesh with size varying from to is used for the nanorod domains. A free tetrahedral mesh with size is used for the domain enclosing the nanorods that is 1.1 μm thick in the radial direction. Outside of these domains, a swept free triangular mesh is used, similar to the 3D bare toroid simulations. We use the same mesh for frequency domain and eigenfrequency simulations.
APPENDIX C: SINGLE NANOROD SIMULATIONS
As an additional validation step and to better understand the wavelength shift induced on the WGM by the nanostructure, we performed a series of TE-mode simulations using only a single nanorod and not a full grating. We validated the results against the prediction from the Bethe–Schwinger cavity perturbation (BSCP) formula [19,47,48], with good agreement, as shown in Fig. 9. The equation used for BSCP is where is the magnitude-squared electric field of the unperturbed cavity at the location of the nanorod, is the maximum magnitude-squared electric field inside the toroid, is the mode volume of the field in the wedge segment, and is the polarizability of the nanorod as a function of aspect ratio [19,49]: where is the nanorod volume, and where is a shape correction to account for the differences between a cylinder and a prolate spheroid [50], and is the eccentricity.
Figure 9.WGM frequency shift for a single nanorod as a function of nanorod aspect ratio (AR).
Although the fit is good between FloWBEM and BSCP for a single rod, BSCP is not expected to be a good model for the grating, as it is known that systems that are designed to efficiently radiate are not well-described by BSCP [35].