Abstract
Three tungsten powder samples—one coarse grained (c-W; grain size: 1 μm–3 μm) and two nanocrystalline (n-W; average grain sizes: 10 nm and 50 nm)—are investigated under nonhydrostatic compression in a diamond anvil cell in separate experiments, and their in situ X-ray diffraction patterns are recorded. The maximum microscopic deviatoric stress in each tungsten sample, a measure of the yield strength, is determined by analyzing the diffraction line width. Over the entire pressure range, the strength of tungsten increases noticeably as the grain size is decreased from 1 μm–3 μm to 10 nm. The results show that the yield strength of tungsten with an average crystal size of 10 nm is around 3.5 times that of the sample with a grain size of 1 μm–3 μm.I. INTRODUCTION
In the 1950s, Hall1 and Petch2 found experimentally that the strength of low-carbon steels (σ) is inversely dependent on the grain size (d), leading to the Hall–Petch (HP) relationwhere k is a constant and σ0 is some base resistance of the constituent single crystal. Subsequent experimental studies showed that the HP effect also pertains to other alloys and pure metals.3 The HP relation predicts extremely high strength when the grain size is reduced to the nanoscale, but both strength softening and strengthening with decreasing grain size have been reported.4–12 Some experiments have reported size softening (inverse HP effect), and samples either showed obvious artifacts or were at least problematic.13 A controversy is whether the HP relation breaks down when the grain size is smaller than the critical size. It is difficult to demonstrate HP breakdown by experiments on a pure metal, the reasons being (i) the rapid grain growth in pure nanostructured metals at low homologous temperatures and (ii) the possibility of grain growth during plastic deformation. Moreover, the structure and state of the grain boundaries can also influence the strength considerably.14 X-ray diffraction (XRD) can be used to measure directly the average yield strength of a single grain, thereby avoiding effects due to bulk sample quality (porosity, grain-boundary bonding, etc.) in indentation or deformation experiments.15
Tungsten (W) is a technologically important material because of its excellent properties. The strength characteristics of incompressible materials (e.g., W and Re) are important for optimizing the design and operation of high-pressure equipment.16,17 Meanwhile, W has a high melting point and is not easily oxidized. Therefore, we studied how grain size affects the yield strength of W by using in situ angle-dispersive XRD in a symmetric diamond anvil cell (DAC). Experiments were carried out using W powders with average grain sizes of 10 nm, 50 nm, and 1 µm–3 µm.
II. EXPERIMENTAL DETAILS
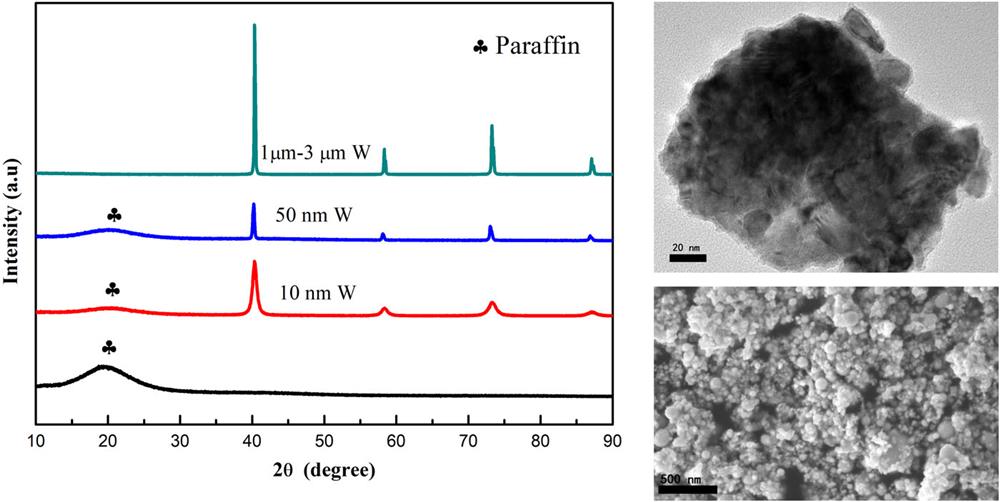
We used XRD to characterize nano-W powders (99.9%; grain sizes: 10 nm and 50 nm; Renxin Metal Materials, China) and micro-W powder (99.9%; grain size: 1 µm–3 µm; Nangong Xindun Alloys Spraying Co. Ltd., China). To avoid exposing the nano-W powders to oxygen, we loaded the nano-W in an inert-gas protection box and a layer of paraffin oil was spread over the sample before performing XRD. The influence of grain size means that the diffraction-peak full width at half maximum (FWHM) of 10-nm W is much larger than those of 50-nm W and micro-W, as shown in Fig. 1(a). We use the Scherrer equation D = λ/(β cos θ)—where λ is the X-ray wavelength, β is the FWHM of the diffraction peak, and θ is the diffraction angle—to obtain the particle sizes of the nanocrystalline samples as ∼10 nm and 70 nm. We also used scanning and transmission electron microscopy to analyze the size distributions and morphologies of the 10-nm and 50-nm W samples, which gives average grain sizes of 10 nm and 50 nm as shown in Fig. 1(b) and 1(c).

Figure 1.(a) X-ray diffraction (XRD) patterns (λ = 1.5404 Å) of W with different grain sizes. (b) Transmission electron microscopy image of 10-nm W powder. (c) Scanning electron microscopy image of 50-nm W powder.
High-pressure experiments were carried out using a DAC with 300-µm-diameter diamond-anvil flat faces to compress the W samples. A stainless-steel gasket with a thickness of ∼40 μm was precompressed at 16 GPa using the DAC, then a 100-μm-diameter hole was drilled in the center of the indentation as the sample container. To provide a nonhydrostatic environment, the sample chamber was devoid of any pressure-transmitting medium. A 5-µm ruby sphere was placed on top of the sample center and used as a pressure marker.18 The in situ high-pressure angle-dispersive synchrotron XRD (AXRD) experiments were carried out in a DAC at the 4W2 high-pressure station of the Beijing Synchrotron Radiation Facility at room temperature. The incident X-ray beam had a wavelength of 0.061 99 nm and was collimated to a cross section of 38 × 22 µm2. Conventional intensity–2θ diffraction curves were obtained by integrating the two-dimensional diffraction patterns using the Fit2D software. Further analysis gave the lattice parameters and high-pressure X-ray scattering data.19
III. METHOD OF DATA ANALYSIS
At the beginning of compression, the sample between the anvils is greatly deformed. When the flow stops and reaches equilibrium, complex stresses are established that are considered as a superposition of a macroscopic differential stress and a microscopic deviatoric stress.20 The macro-stresses generate strains that shift the positions of the diffraction lines, and the micro-stresses broaden the diffraction lines. There are two different ways to measure the compressive strength of the material, namely (i) analyze the peak widths or (ii) measure the peak shifts related to the lattice strains. By comparing these two approaches under uniaxial compression in a DAC, He and Duffy21 showed that they are consistent.
Particle size, micro-strains, and instrumental factors are among the major sources of diffraction-line broadening. We use the previously proposed theory of diffraction-line broadening for a deformed metal to analyze the high-pressure data.22 How the line width depends on micro-strain and grain-size is expressed by23where 2ωhkl is the FWHM corrected for instrumental effects. Instrumental broadening can be measured using a stress-free sample with a known grain size, but in the present work instrumental broadening was corrected using the diffraction pattern of the sample under the minimum pressure. Also in Eq. (2), λ is the X-ray wavelength, θhkl is the Bragg angle, d is the grain size of the crystallites, and ηhkl is the micro-strain. The microscopic deviatoric stress can be obtained by multiplying the Young's modulus E for the polycrystalline sample under non-hydrostatic compression if the micro-strain is known.
IV. RESULTS AND DISCUSSION
The pressure evolution of the selected AXRD patterns of W with different grain sizes is shown in Fig. 2. With increasing pressure, the Bragg peaks are shifted systematically and monotonically to higher 2θ angle. When the pressure of the 50-nm and 1-µm–3-µm samples reaches ∼25 GPa and ∼15 GPa, respectively, the diffraction signal of the 211 crystal plane disappears.
Figure 2.XRD patterns of W under various pressures at room temperature: (a) 10 nm; (b) 50 nm; (c) 1 μm–3 μm.
Under nonhydrostatic compression conditions, the local deviatoric stress, which is from the mutual contact and extrusion between W grains, broadens the diffraction lines of the polycrystalline sample. The FWHMs of the (110), (200), and (211) diffraction peaks of the 10-nm, 50-nm, and 1 μm–3 µm W at different pressures are shown in Fig. 3. The line widths increase obviously with increasing pressure at the initial compression stage and then narrow with further compression, which takes place at ∼4 GPa and ∼15 GPa for the 1-μm–3-µm and 10-nm W samples, respectively. This indicates that the local stress is partially relaxed when the diffraction lines narrow. Plastic deformation of the W sample means that the yield strength of W may increase with pressure, which is known as work hardening.
Figure 3.Full width at half maximum (FWHM) of (110), (200), and (211) diffraction peaks of 10-nm, 50-nm, and 1 μm–3 μm W powders under various pressures.
The diffraction-line profiles from the samples exhibit broadening under nonhydrostatic compression. The line widths are corrected for each pressure run to plot (2ωhkl cos θhkl)2 vs sin2 θhkl. Figure 4 shows the typical plots. Each data set can be fitted with a linear function. The average grain size and deviatoric strain distribution can be derived by plotting (2ωhkl cos θhkl)2 as a function of sin2 θhkl. We can derive the change of crystallite size with increasing pressure from the intercept of the straight line drawn through the data points from Eq. (2). Figure 5 shows the calculated grain size of the starting 10-nm W sample under different pressures. The initial grain size of the nano-sample is ∼10 nm, and there is no obvious change of grain size in the error range with increasing pressure. The intercept of the (2ωhkl cos θhkl)2 vs sin2 θhkl lines is relatively small for the 1-µm–3-µm sample because the initial grain size of the micro-sample is relatively large. The limitation of detector resolution meant that changes in the grain size of the micro-sample could not be detected. For the above reasons, we excluded from the data analysis the influence of grain-size change of the samples under high pressure.
Figure 4.Plots of (2ω cos θ)2 vs sin2 θ for 10-nm W.
Figure 5.Change in grain size of 10-nm W under nonhydrostatic compression.
The deviatoric strain is derived from the slope of the straight lines in Eq. (2), then the microscopic deviatoric stress is calculated by multiplying ηhkl by the aggregate Young’s modulus. The single-crystal elastic moduli Cij and their pressure derivatives ∂Cij/∂P were measured in ultrasonic experiments at 25 °C up to 5 kbar for W.24 The Cij at high pressure were obtained using these data and third-order Eulerian finite-strain equations. The aggregate Young’s modulus E was derived from the Cij at high pressure. With E known, the deviatoric strain can be converted to the microscopic deviatoric stress. The microscopic deviatoric stress vs pressure is plotted in Fig. 6 for different W grain sizes. Before the stress reached the yield strength of each sample, the linear dependence of the microscopic deviatoric stress with pressure in the three samples indicates that the loading process was elastic. When the sample began to yield, the stress saturated and remained approximately constant with further increases of load. The stress of 1-μm–3-μm W agrees well with that obtained from the radial x-ray diffraction (RXRD) experiments performed by He and Duffy21 and Xiong et al.25 This indicates that the yield strength obtained from analyzing X-ray peak broadening is consistent with that derived from strain theory. The micrometer-sized W yielded when the microscopic deviatoric stress reached ∼4 GPa, whereas the 50-nm and 10-nm W did not yield until the microscopic deviatoric stress reached ∼7 GPa and ∼14 GPa, respectively. The stress–load curve plateaus after yielding.
Figure 6.Microscopic deviatoric stress as a function of pressure. Black squares: 10-nm W; red circles: 50-nm W; green triangles: 1-µm–3-µm W; blue inverted triangles and cyan diamonds: micro-W from Ref. 21; pink triangles: micro-W from Ref. 25.
The above results show that the yield strength of 10-nm W increases by a factor of 2.5-fold compared to 1-3 μm W. This indicates that the previously reported inverse HP effect may be due to porosity, bond strength between grains, introduction of impurities, uneven particle size, and change in grain morphology during sample preparation. It is also possible that, as discussed by Hu et al.26 and Lu,27 the deformation mechanism of the nano metal changes because of the difference in grain-boundary type and state, leading to the softening of the nano metals.
V. CONCLUSION
The average yield strength of individual grains of W was measured by using synchrotron AXRD measurements under nonhydrostatic compression. The previously reported data on the relationship between strength and grain size from indentation or deformation experiments might be affected by the influence of bulk sample quality (porosity, impurities, grain–grain binding, etc.). Our experimental results show (i) a greatly enhanced yield strength for the W samples by reducing the grain size and (ii) that the HP effect does not break down even at the nanoscale. When the grain size is reduced down to 10 nm, the yield strength of W is around 3.5 times that for the micrometer-grained W.
References
[1] E. O. Hall. The deformation and ageing of mild steel: III. Discussion of results. Proc. Phys. Soc. B, 64, 747-753(1951).
[2] N. J. Petch. The cleavage strength of polycrystals. J. Iron Steel Inst., 174, 25-28(1953).
[3] R. W. Armstrong. The influence of polycrystal grain size on several mechanical properties of materials. Metall. Mater. Trans. B, 1, 1169-1176(1970).
[4] A. H. Chokshi, A. Rosen, H. Gleiter, J. Karch. On the validity of the Hall-Petch relationship in nanocrystalline materials. Scr. Metall., 23, 1679-1683(1989).
[5] J. Narayan. Size and interface control of novel nanocrystalline materials using pulsed laser deposition. J. Nanopart. Res., 2, 91-96(2000).
[6] T. Yamasaki, T. G. Nieh, C. A. Schuh. Hall–Petch breakdown manifested in abrasive wear resistance of nanocrystalline nickel. Scr. Metall., 46, 735-740(2002).
[7] K. W. Jacobsen, J. Schiotz. A maximum in the strength of nanocrystalline copper. Science, 301, 1357-1359(2003).
[8] D. M. Follstaedt, J. A. Knapp. Hall–Petch relationship in pulsed-laser deposited nickel films. J. Mater. Res., 19, 218-227(2004).
[9] D. J. Benson, A. Mishra, M. A. Meyers. Mechanical properties of nanocrystalline materials. Prog. Mater. Sci., 51, 427-556(2006).
[10] X. Huang, N. Tsuji, N. Hansen. Hardening by annealing and softening by deformation in nanostructured metals. Science, 312, 249-251(2006).
[11] X. Huang, K. Lu, L. Lu, X. Chen. Revealing the maximum strength in nanotwinned copper. Science, 323, 607-610(2009).
[12] J. Xu, L. Zhu, L. Miyagi, H. Dong, X. Zhou, Z. Feng et al. High-pressure strengthening in ultrafine-grained metals. Nature, 579, 67-72(2020).
[13] C. C. Koch, J. Narayan. The inverse Hall-Petch effect—Fact or artifact?. Mat. Res. Soc. Symp., 634, B5.1.1(2000).
[14] M. Atzmon, D. Jang. Grain-size dependence of plastic deformation in nanocrystalline Fe. Appl. Phys., 93, 9282-9286(2003).
[15] A. D. Westwood, I. C. Noyan, C. E. Murray. In-situ study of dynamic structural rearrangements during stress relaxation. Adv. X-Ray Anal., 38, 243-254(1995).
[16] A. L. Ruoff, N. E. Christensen, C. O. Rodriguez. Pressure strengthening: A way to multimegabar static pressures. Phys. Rev. B, 52, 9121-9124(1995).
[17] J. Badro, R. J. Hemley, G. Shen, D. Hausermann, H. Mao, P. Gillet, M. Hanfland. X-ray imaging of stress and strain of diamond, iron, and tungsten at megabar pressures. Science, 276, 1242-1245(1997).
[18] P. M. Bell, H. K. Mao, J. Xu. Calibration of the ruby pressure gauge to 800 kbar under quasi‐hydrostatic conditions. J. Geophys. Res.: Solid Earth, 91, 4673-4676(1986).
[19] M. Hanfland, D. Hausermann, A. P. Hammersley, A. N. Fitch, S. O. Svensson. Two-dimensional detector software: From real detector to idealised image or two-theta scan. High Pressure Res., 14, 235-248(1996).
[20] H. P. Liermann, S. K. Saxena, A. K. Singh, A. Jain. Strength of iron under pressure up to 55 GPa from X-ray diffraction line-width analysis. J. Phys. Chem. Solids, 67, 2197-2202(2006).
[21] D. He, T. S. Duffy. X-ray diffraction study of the static strength of tungsten to 69 GPa. Phys. Rev. B, 73, 134106(2006).
[22] Y. Wang, D. J. Weidner, M. T. Vaughan. Strength of diamond. Science, 266, 419-422(1994).
[23] J. I. Langford. X-ray powder diffraction studies of vitromet samples. J. Appl. Crystallogr., 4, 164-168(1971).
[24] K. W. Katahara, M. H. Manghnani, E. S. Fisher. Pressure derivatives of the elastic moduli of BCC Ti-V-Cr, Nb-Mo and Ta-W alloys. J. Phys. F: Met. Phys., 9, 773-790(1978).
[25] B. Li, Q. Li, L. Bai, L. Xiong, J. Hao, Y. Tang et al. Radial X-ray diffraction study of the static strength and texture of tungsten to 96 GPa. Solid State Commun., 269, 83-89(2018).
[26] J. Hu, K. Lu, X. Sauvage, Y. N. Shi, G. Sha. Grain boundary stability governs hardening and softening in extremely fine nanograined metals. Science, 355, 1292(2017).
[27] K. Lu. Stabilizing nanostructures in metals using grain and twin boundary architectures. Nat. Rev. Mater., 1, 16019(2016).