Author Affiliations
1Chinese Academy of Sciences, Shanghai Institute of Ceramics, State Key Laboratory of High Performance Ceramics and Superfine Microstructure, Shanghai, China2University of Chinese Academy of Sciences, Center of Materials Science and Optoelectronics Engineering, Beijing, China3Chinese Academy of Sciences, Institute of High Energy Physics, Beijing, China4Western University, Department of Chemistry, London, Ontario, Canada5Zhejiang University, School of Materials Science and Engineering, Hangzhou, China6Taiwan Synchrotron Radiation Centre, Hsinchu, China7Chinese Academy of Sciences, Shanghai Institute of Optics and Fine Mechanics, Laboratory of Micro-Nano Optoelectronic Materials and Devices, Shanghai, China8North China University of Science and Technology, College of Materials Science and Engineering, Hebei Provincial Key Laboratory of Inorganic Nonmetallic Materials, Tangshan, China9Taizhou University, School of Materials Science and Engineering, Taizhou, Chinashow less
Fig. 1. NTQ performance and mechanism of phosphor. (a) The crystal structure of , where white, gray, and light blue spheres represent oxygen, Li in [] octahedra, and Ta in [TaO6] octahedra, respectively. These octahedra units are stacked closely together in the form of a co-triangular oxygen plane. (b) Temperature-dependent emission profile of under 250 nm excitation in the temperature range from 305 to 498 K. (c) Temperature-dependent normalized emission intensity of under 250 nm excitation in comparison to other commercial and advanced inorganic phosphors. Three color fillings represent three consecutive temperature zones: 305 to 373 K, 373 to 423 K, and 423 to 473 K, respectively. The results imply that shows relatively stable and increased emission in the working temperature range 373 to 473 K. (d)–(f) Schematic diagrams of triple gradient defects , , and , existing in . (g)–(i) Schematic illustrations of triple defects-induced NTQ mechanisms. Triple defects with varied trapping depths could provide thermal increasing compensation in three consecutive temperature zones, thus achieving NTQ performance in a wide temperature range.
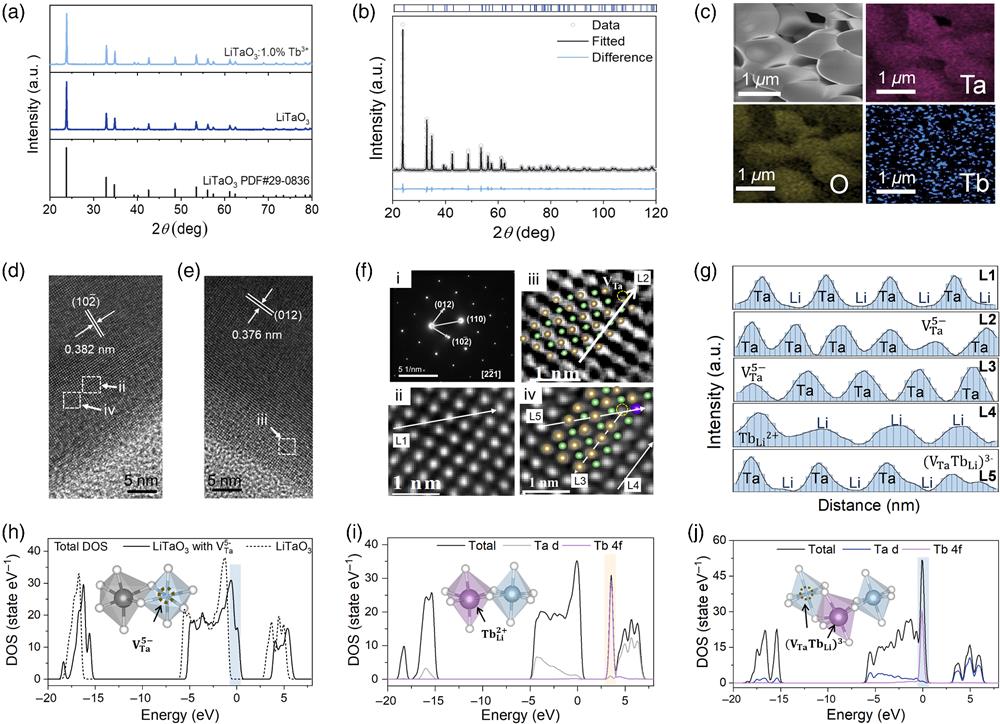
Fig. 2. Structural characterizations of phosphor. (a) XRD patterns for and . (b) XRD Rietveld refinement of with the measured and calculated data. (c) SEM and EDS mapping images of , implying the uniform doping of Tb throughout the whole particle. (d), and (e) HRTEM images of . (f) SAED (i) and filtered images (ii–iv) of regions within dashed white squares in (d)–(e). (g) Intensity profiles along the – lines recorded from (f) (ii–iv). The results confirm the existence of the , , and defects in the lattice of . (h)–(j) DFT calculations of with and without ,, and defects, where gray, light blue, white, and purple spheres represent Li, Ta, O, and Tb atoms, respectively. In (h), the solid line represents the total DOS for perfect lattice , while the dotted line represents the total DOS for with .
Fig. 3. Identification of defects in . (a) TL curve of with the fitted three peaks , and in different temperature zones, corresponding to three defects, respectively. (b) The calculated trap depths and integral areas of three defects [, , ]. (c) Experimental positron annihilation lifetime spectrum of with deconvolution fitting components. The results show two components, and , ascribed to and , respectively. The inset shows the percentages of the and components. (d) The relative ratios of two defects [, ] in with doping concentrations, obtained from the TL and PALS deconvolution results, respectively. (e) and (f) Positron density isosurface localized at and defects obtained using ABINIT. Yellow represents the positron accumulation. (g) TL curves of before and after reduction treatment at 1273 K for 2 h in mixed 95% Ar/5% H2 atmosphere. (h) Comparison of thermal stability of different LiTaO3:Tb3+ samples. (i) PL decay curves of at increasing temperature from 305 to 498 K. These results provide sufficient evidence that triple defects with varied trapping depths in could promote NTQ performance in a wide temperature range.
Fig. 4. Chemical environments and structures of and . (a) High-resolution Ta XPS spectra and (b) Raman spectra of LiTaO3:1%Tb3+ and . and stand for the modes of Ta-O framework deformation. The inset in (b) shows the integrated area ratios of . (c) (i) Temperature-dependent in situ Raman spectra with the temperature range from 305 to 498 K, and (ii) Raman shifts of different modes with changing temperatures. , , and represent Li–O stretching, O-Ta-O bending mode, and Ta-O stretching mode, respectively. (d) The EXAFS curves in R-space of and . (e) XANES spectra of the Tb L3 edge, recorded from and reference sample.
Fig. 5. DFT calculations of defect systems. (a1)–(a3) Defect structure models of , and in LiTaO3. (b1)–(b3) (c1)–(c3) Charge density difference of LiTaO3 with different defects. Yellow represents accumulation of electrons; cyan represents depletion of electrons.
Fig. 6. Applications in temperature-dependent decryption, multiple-information storage, and pressure sensing. (a) Schematic diagram of temperature-dependent decrypting process. The information is encrypted by UV irradiation at 298 K. The rise of the temperature to 353 K results in a readout of defect-stored information. After cooling to 298 K, the further increase of temperature to 398 and 453 K successively could decrypt the information stored in and defects, respectively. (b) Schematic diagram of TL curves for temperature-dependent decrypting of triple defects. The dotted line indicates that the encrypted information in the defect is decrypted and read out at the corresponding temperature, and the blue filling represents that the information is still stably stored in the defect. (c) Temperature-dependent decrypting photos of a phosphor wafer with a diameter of 1 cm treated as the process in (a). After UV irradiation for 5 min, the wafer is heated up to 353, 398, and 453 K on a hot plate successively, and treatment at each temperature lasted for 60 s. The information is decoded by luminescence. (d) Schematic diagram of multiple information storage. The phosphor film is encrypted with the message whale under UV radiation with a mask, and then the charge carriers in the defect are partially emptied by heating at 423 K. The horse pattern is then written at 298 K and is partially emptied at 373 K for 30 s. Finally, encryption of the butterfly pattern was performed at RT. (e) The information pattern decrypted by heating and the corresponding spectrogram. At 298 K, the encrypted message is invisible. The butterfly pattern is decrypted at 353 K, and the horse and whale patterns could be read out at 398 and 453 K, respectively. (f) Schematic diagram of pressure sensing. The cylindrical sample is clipped in the fixture (i), and charged by UV light for 5 min (ii). After UV off and afterglow dissipation (iii), pressure was applied for 0, 5, 10 and 16 s, showing the corresponding pressure sensing images (iv). (g) The pressure sensing curve of intensity versus time obtained by cyclically applying a pressure of 2 kN after UV charging. This indicates that the information stored in the triple defects could be continuously decrypted by applying stress.