Guyue Hu, Qiao Ran, Beth Wing Lam So, Mingsheng Li, Jiawei Shi, Xin Dong, Jiqiang Kang, Kenneth K. Y. Wong, "Noncontact photoacoustic lipid imaging by remote sensing on first overtone of the C-H bond," Adv. Photon. Nexus 2, 026011 (2023)
Copy Citation Text
Lipid imaging by conventional photoacoustic microscopy subjects to direct contact sensing with relatively low detection bandwidth and sensitivity, which induces superficial imaging depth and low signal-to-noise ratio (SNR) in practical imaging scenarios. Herein, we present a photoacoustic remote sensing microscopy for lipid distribution mapping in bio-tissue, featuring noncontact implementation, broad detection bandwidth, deep penetration depth, and high SNR. A tailored high-energy pulsed laser source with a spectrum centered at 1750 nm is used as the excitation beam, while a cofocused 1550 nm continuous-wave beam is used as the probe signal. The pump wavelength is selected to overlap the first overtone of the C-H bond in response to the intensive absorption of lipid molecules, which introduces a much-enhanced SNR (55 dB) onto photoacoustic remote sensing (PARS) signals. Meanwhile, the optical sensing scheme of the photoacoustic signals provides broadband detection compared to the acoustic transducer and refrains the bio-samples from direct contact operations by eliminating the ultrasonic coupling medium. Taking merits of the high detection sensitivity, deep penetration depth, broadband detection, and high resolution of the PARS system, high-quality tissue scale lipid imaging is demonstrated in a model organism and brain slice.
As one of the most central kinds of biomolecules of interest, lipids perform versatile roles in metabolism, structural maintenance, energy conservation, as well as signal transmission. Especially, the content, distribution, and molecular composition of lipids provide insightful information for varied disease prognostication and diagnosis, constituting essential bio-hallmarks for obesity, diabetes, atherosclerosis, coronary heart disease, and so forth.1–3 Many techniques have been developed and employed for lipids studies, including but not limited to lipophilic dyeing, mass spectroscopy, fluorescent microscopy, and Raman microscopy.4–8 However, these examinations of lipids hinge on biopsy invasion or external labeling, which demands complex sample preparation procedures and might incur toxicity or changes in metabolic conditions.7–10 Hence, a label-free and noninvasive imaging modality is desired for biomedical lipid studies, which eliminates biosafety concerns and allows easy implementation.
Photoacoustic microscopy (PAM) is an emerging powerful imaging technique that provides acoustic pressure distributions induced by light absorption based on the photoacoustic effect. Unlike pure optical or fluorescent microscopy, PAM acoustically detects unique optical contrast by accessing the intrinsic molecular absorption, which makes it label-free and noninvasive without exogenous labeling or tissue invasion.11,12 By virtue of its excellent scalability, PAM has been extensively utilized to conduct exquisite studies on microvessels, gene expression, contrast agents, and so on.13–16 Nonetheless, conventional PAM utilizing an ultrasound transducer for acoustic detection necessitates tight coupling with the sample by water or ultrasound gel, severely limiting the applicability in many practical scenarios when physical contact or immersion is undesirable.17,18 Moreover, the center response frequency and detection bandwidth of the acoustic transducers are such due to their innate piezoelectric nature, that it may diminish detection sensitivity in terms of broadband information.19,20 Considering these, resolving the inherent tight coupling and bandwidth problems of conventional PAM is of great significance for promoting varied biomedical research on lipids.
As a recently developed PAM, photoacoustic remote sensing (PARS) microscopy is earning increasing attention from scientists, since it outperforms conventional PAM in some critical respects. On one hand, PARS detects elasto-optical refractive index modulation due to photoacoustic initial pressure through an interrogation beam instead of a transducer.21,22 Therefore, the additional acoustic coupling is circumvented, which protects the sample from tight contact or immersion. On the other hand, because of optical sensing of the acoustic signals, the detection bandwidth could be easily transferred from limited ultrasonic transducers to much broader ones provided by photodiodes (PDs).22,23 Therefore, PARS enables broadband detection of photoacoustic signals. This merit potentially enhances the detection sensitivity of Photoacoustic (PA) signals from samples with unique absorption properties. Given advantages of the PARS technique, some researchers tried to apply it to lipid imaging.24,25 For instance, Kedarisetti et al.24 successfully used a 1225 nm Raman beam as an excitation source, which demonstrates lipid imaging on phantom samples. However, their excitation focuses on the second overtone of the C-H bond, a region in which the increasing overtones are characterized by a decreasing absorption coefficient.25 In contrast, lipid absorption in the first overtone range (1600 to 1850 nm) of the C-H bond possesses significant advantages, which manifests an enhancement by an order of magnitude, thus improving the signal-to-noise ratio (SNR).26,27 Meanwhile, the longer wavelength offers deeper penetration depth for reduced scattering and introduces lower photodamage, which renders exquisite tissue scale lipid imaging more accessible.27,28
Sign up for Advanced Photonics Nexus TOC. Get the latest issue of Advanced Photonics Nexus delivered right to you!Sign up now
Herein, we present a PARS microscopy for lipid distribution mapping in bio-tissue using a tailored high-energy pulsed laser source with a spectrum centered at 1750 nm, targeting the first vibrational overtone of the C-H bond. The absorption at the first overtone of the C-H bond is about 10 times higher than that of the conventional second overtone, which bestows a higher SNR. Local initial pressure induced by absorption is detected optically by a 1550 nm continuous-wave (CW) beam without additional acoustic coupling, which allows ease of implementation and wide applicability in varied biomedical scenarios. Taking advantages of the higher absorption of lipids at , deep penetration depth of longer wavelength, broadband detection of the PARS system, high-contrast and high-resolution photoacoustic images are captured both in the model organism and mouse brain slice, which proves the capability of tissue-scale lipid imaging of the scheme.
2 Methods
2.1 Principle of Enhancement of the PARS Signals at the First Overtone of the C-H Bond
Generally, near-infrared (NIR)-PAM-based lipid imaging suggests lower detection sensitivity and demands higher pulse energy of excitation beam due to much lower absorption coefficient of fat, compared with that of hemoglobin, nucleic acids, and so forth.22,24 To relieve this problem, stronger absorption at the first overtone vibration of the C-H bond could be excited, thus releasing the requirement of laser energy and improving the SNR of the PARS signals. A short analysis of the enhancement in terms of the PARS signals is presented as follows.21–23 The photoacoustic initial pressure due to local absorption is determined by , where is the Grüneisen parameter, is the incident fluence, and is the optical absorption coefficient. The resulting refractive index perturbation modulated due to the initial pressure follows the elasto-optic relation, where is the elasto-optic coefficient, is the pressure field of the local spot, is the density, and is the speed of sound. Assuming the refractive index perturbation is generated at an interface, then the intensity-reflection coefficient perturbation at the boundary is induced as where is the unperturbed intensity–reflection, and and are the refractive indices of the medium on the interface. Taking , where and are the absorption coefficients at the first and second overtones of the C-H bond, respectively, then , where and are their corresponding refractive index perturbations, respectively. Therefore, the intensity–reflection coefficient perturbations at the first () and second () overtones of the C-H are given as
To simplify the numerical calculation, assume , and because , thus the enhancement of against , is determined as which suggests a quadratic behavior of enhancement towards the PARS signals at the first overtone of the C-H bond compared with that of the second overtone band. Taking a general factor as 6.3, it eventually leads to an enhancement factor of .27 This enhancement significantly contributes to both detection sensitivity and SNR.
2.2 Experimental Setup
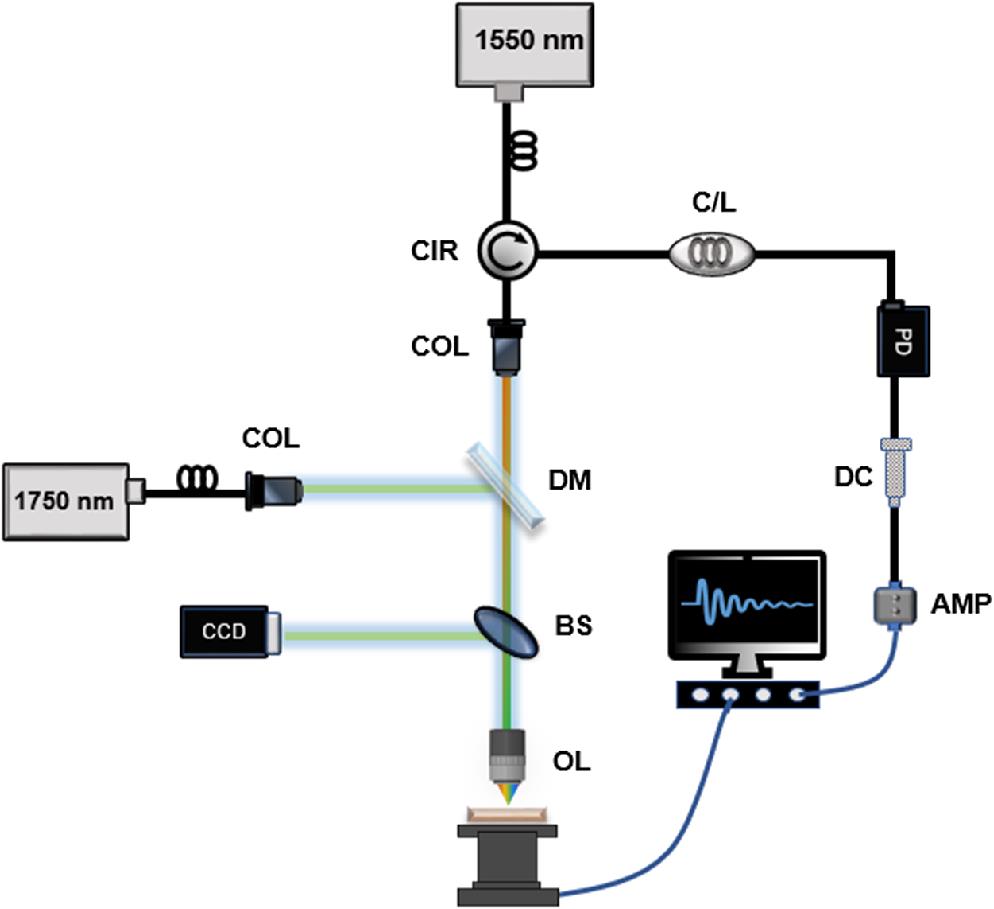
The experimental setup of the PARS system is presented in Fig. 1. One homemade nanosecond source centered at 1750 nm is adopted as the excitation beam to take advantage of the intensive stimulation capability at the first overtone of the C-H bond.26,29 The source is based on a thulium-doped fiber laser, which possesses a repetition rate of 10 kHz and a minimum pulse duration of 16.7 ns.26 In order to minimize chromatic aberration, a near wavelength low-coherence CW source around 1550 nm is selected as an interrogation beam to monitor the refractive index modulation on the spot cofocused with the excitation beam. The probe beam is measured in a noninterferometric design to eliminate redundant phase noise, and its intensity oscillation is monitored exclusively. The two beams are collimated and combined by a dichroic mirror (LPF1550, Thorlabs). Afterward, they are tightly focused on the sample using a broadband high numerical aperture (NA) achromatic objective lens (0.65 NA, M Plan Apo NIR 50X, Mitutoyo) to alleviate chromatic aberration. The co-focus and co-alignment situation of the two beams are adjusted according to the monitoring of the back-reflected light by a camera (SWIR 316166, Photonic Science). A two-axis mechanical stage driven by a controller (ESP 301, Newport) provides system scanning with lateral sample movement down to . The backscattered probe beam from the sample is directed into a circulator (6015-3, Thorlabs), which circumvents bulky spatial components such as a quarter-wave plate (QWP) and a polarized beam splitter (PBS). The probe beam after the circulator is filtered by two consecutive C/L band filters to screen out excessive excitation beam and is captured by a 15-MHz bandwidth InGaAs photodiode (PDB140C, Thorlabs). The output of the PD is followed by a DC Block (BLK-6-N+, Minicircuits) to diminish DC noise, and then amplified using an RF amplifier (VCA810, Kangwei) with 40 dB gain. The final signal is digitized by an oscilloscope (DS2302A, Rigol) at a sampling rate of 200 MHz.
Figure 1.Scheme of the PARS setup. CIR, circulator; COL, collimator; DM, dichroic mirror; BS, beam splitter; OL, objective lens; CCD, charge-coupled device; C/L, C/L band filter; PD, photodiode; DC, DC block; AMP, amplifier.
Because carbon fiber produces an intensive photoacoustic signal under modest stimulation, it is utilized here for studying the imaging performance of the PARS system.21,23Figure 2(a) presents a PARS image of carbon fiber networks free of water, prepared with a glass slide and coverslip. The image is obtained under excitation pulse energy and interrogation power. Several parallel carbon fibers are displayed in the field of view, which demonstrates the PA imaging capability of the system. Given that a relatively large NA objective lens is exploited in the system which results in a small depth of focus (DOF), some of the carbon fiber shows brighter contrast compared with the others because they locate exactly in the center of the DOF, which induces the most intensive signal. A representative PARS signal is captured as a function of time, as shown in Fig. 2(b). The signal is acquired by imaging a single carbon fiber with optimum focus. Note that the excitation light has already been filtered out; otherwise, the PARS signal is exactly following the excitation pulse, which also suggests that the PARS signal is sorely associated with the initial pressure and does not provide time of flight (TOF) characteristics. The resolution of the PARS system is also characterized by imaging a single carbon fiber. As shown in Fig. 2(c), the edge spread function (ESF) of the carbon fiber is fitted with the raw data, from which the line spread function (LSF) is obtained by calculating its derivative. The lateral resolution is determined to be as by its full width at half maximum (FWHM) (). To characterize the axial resolution of the system, an A-scan of the carbon fiber is performed at different depths. The raw data is fitted into a Gaussian profile, and the axial FWHM resolution is determined to be () [Fig. 2(d)]. Furthermore, the SNR, defined as the average of the maximum amplitude projection in the spot of interest over the standard deviation of the noise, is quantified as . The SNR attainable by this system is higher than the previous second overtone excitation (45 dB), which might result from various factors such as differing refractive indices, greater absorption coefficients and tighter focusing conditions in this study.24
Figure 2.Imaging results of carbon fibers. (a) PARS image of carbon fiber networks. (b) Typical PARS signal of a single carbon fiber in the time domain. (c) Lateral resolution of the PARS system by scanning a carbon fiber, resulting in an FWHM of . (d) Axial resolution of the system by an A-scan of a carbon fiber, with an FWHM of .
To verify the capability of the PARS system for practical lipid contrast imaging, two phantom samples of oil or fat are selected and investigated. As displayed in Fig. 3(a), a droplet of olive oil is dropped on the glass slide without coverage, and the PARS signal is collected accordingly. The image shows a clear shape of the oil droplet, with the center of it presenting the most intensive signal. For solid-state lipid sample, butter is selected and prepared with a specific negative branch pattern in order to form a more obvious contrast. As shown in Fig. 3(b), the pattern could be easily distinguished as positive sites generate strong PARS signals. Meanwhile, their time domain signals and corresponding frequency response bandwidth are recorded and analyzed. Figure 3(c) shows the time domain signals of the oil and butter, in which the signal of oil resembles a sinusoidal waveform, while that of the butter is more complex. In the frequency domain, both frequency response bandwidth peaks around 2 MHz as suggested in Fig. 3(d). For the olive oil, the higher frequency response drops near linearly, however, that of the butter sample still presents a relatively higher response from 4 to 14 MHz. It is hypothesized that compared with pure olive oil, butter (80% fat) contains more nonlipid impurities, which might lead to relatively higher frequency modulations. Notably, the PARS signals of the selected samples predominate around 2 MHz and extend to . The and bandwidths of the PARS signal of the olive oil are measured as and , respectively, while those of the butter are and , respectively. Because the PARS mechanism starts in the same way as conventional photoacoustics when the initial photoacoustic pressure rises, which shall induce primarily analogous power-spectral density of the PA signals, the detection bandwidth by conventional PAM is also drawn for a proof-of-concept comparison.21 Specifically, even for some high-quality ultrasound transducers which possess a 6-dB fractional bandwidth of 70% of the center frequency, for instance, an 8-MHz centered transducer with a 6-dB bandwidth from 5.2 to 10.8 MHz, is unable to cover the whole band of the signal, let alone the severe diminish of sensitivity in terms of the marginal frequencies.18,30 Whereas, because of optical detection of the acoustic signals, the inherent bandwidth limitations within transducers are eliminated, such that the intact PARS signals could be smoothly collected without sacrificing any sensitivity. The SNRs of the PARS signals of the olive oil and butter are and , respectively. These phantom studies demonstrate reliable imaging ability and broad detection bandwidth of the PARS system for absorption contrast from lipids.
Figure 3.PARS images of phantom samples. (a) PARS image of a droplet of olive oil. (b) PARS image of solid butter with a specific branch-like pattern. (c) PARS signals of oil and butter in the time domain. (d) frequency responses of the PARS signals.
Compared with phantom samples with highly concentrated lipids, imaging towards biological specimens tends to be more demanding in terms of detection sensitivity and SNR, since the absorption within bio-samples is more sparsely distributed and might locate within deeper instead of superficial sites.28,31 More importantly, conventional PAM using a transducer to detect the acoustic signals necessitates direct contact with or immersion of the bio-samples. This contact operation would inevitably affect the situation of the bio-samples, which might incur physiological or morphological changes in the bio-samples.23,24 Considering these, fresh biological specimens are selected and investigated to evaluate the practical performance of the PARS scheme on the tissue scale through the noncontact operation. Caenorhabditis elegans (C. Elegans) as a kind of typical model organism is chosen for lipid visualization because of its rich lipid content. As inset in Fig. 4(a), the C. Elegans appear as transparent and uniform under bright field microscopy. While under PARS microscopy as in Fig. 4(a), unsegmented structure of the C. Elegans could be distinguished and the unique lipid distribution is suggested within the tissue, which generally exists in the internal region of the body. The highlighted region in the yellow window is further imaged with finer scanning as displayed in Fig. 4(b). The image presents a zoomed-in view of two adjacent C. Elegans, which feature a bilaterally symmetrical structure of the nematode. The hot spots with higher contrasts also suggest the distinct dense distribution of lipids in the C. Elegans, conforming to its lipid metabolism property that the neutral lipids are mainly stored in the intestine within the body.32,33 The SNR of the worm images is determined to be . On the other aspect, the mouse brain slice is also studied by the PARS imaging given that brain is abundant in lipid constitutions. As shown in Fig. 4(c), which fully takes advantages of the resolution and imaging depth of this PARS system, displays delicate structure of the brain slice tissue with a thickness of . The uneven wrinkled contrast formed in the image manifests a shallow longitudinal groove morphology in the region, which could be the sulci that constituting the cerebral cortex. Around the sulci, as highlighted in the white window, some circular shades appear, which might be the sunken formed due to uneven folding of the cortex.34 The image is calculated to have an SNR of and reveals some neuroanatomy of the brain slice, suggesting a good applicability in section specimens. These results together prove the decent detection sensitivity and SNR of the PARS system toward biological samples on an exquisite tissue scale, which also shows that the PARS system is potentially suitable for diverse biomedical studies on lipids.
Figure 4.PARS images of biological samples. (a) PARS image of the unlabeled C. Elegans. The right upper corner figure is the sample under bright-field microscopy. The yellow window shows the enlarged image with a smaller step size, which is displayed as (b). (c) PARS image of the mouse brain slice, of which the white window shows high contrasts of the tissue.
Despite the advancement obtained by this work, there are still some improvements that could be further explored, which are currently limited by our existing conditions. For instance, a lock-in amplifier could be exploited in the signal processing stage to boost the detection sensitivity on a larger scale so that more delicate lipid studies in biomedical fields could be carried out.35,36 Although the attainable 1750 nm source could be advantageous in terms of excitation, it is fixed in respect of spectroscopic analysis. The use of a tunable broadband nanosecond laser covering the whole first overtone of the C-H bond region could allow for systematic spectroscopy studies upon diverse lipids, which could be realized by supercontinuum generation or spectrally shifting through four-wave mixing.37 Additionally, although many bulky spatial optical components (for instance, QWP and PBS) are circumvented, the use of the dichroic mirror and objective lens still impose complexity on the bulkiness and alignment of the free-space light. A more compact configuration of the PARS system could be developed by replacing them with a fiber-based wavelength division multiplexer as well as a specially designed GRIN lens or endoscopy, which potentially miniaturizes the ever-bulky setup and makes it accessible to the internal tissues/organs for biomedical studies.38
Label-free and bond-selective photoacoustic imaging of lipids are presented using an NIR photoacoustic remote sensing microscopy targeting the first vibrational overtone of the C-H bond. The optical detection manner of the PA signals eliminates the additional acoustic coupling with the samples and offers broadband coverage of frequency responses. The strong absorption efficiency of the C-H bond at the first overtone region enables a high SNR ( from a carbon fiber) under moderate irradiation and detection conditions. Taking advantage of the noncontact nature of the implementation and deep penetration depth at the NIR region, tissue-scale lipid imaging is performed both in the model organism and brain slice, demonstrating high performance and wide applicability of the PARS system. It is expected that this work could potentially complement the multispectral techniques of PARS systems as well as provide useful alternatives for diverse biomedical lipid studies.
Guyue Hu, Qiao Ran, Beth Wing Lam So, Mingsheng Li, Jiawei Shi, Xin Dong, Jiqiang Kang, Kenneth K. Y. Wong, "Noncontact photoacoustic lipid imaging by remote sensing on first overtone of the C-H bond," Adv. Photon. Nexus 2, 026011 (2023)