
Chunyue MA, Sawut Mamat, Jie YAO, Isak Gulnur. Spatio-temporal changes of cotton production in China from 1950 to 2015 [J]. Acta Geographica Sinica, 2020, 75(8): 1699
- Acta Geographica Sinica
- Vol. 75, Issue 8, 1699 (2020)
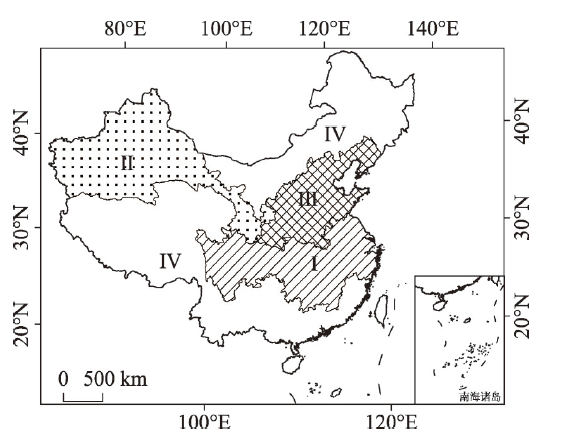
Fig. 1. Regionalization of cotton cropping in China
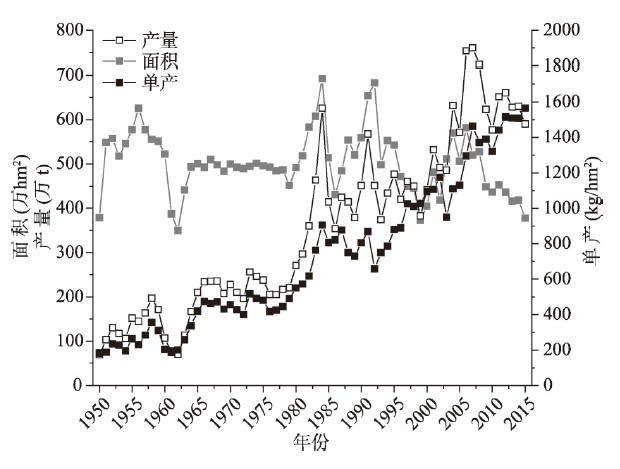
Fig. 2. Changes of cotton production, planting area, per unit area yield in China from 1950 to 2015
Fig. 3. Range of variation of cotton yields in China from 1950 to 2015
Fig. 4. Change distribution of cotton planting area in China from 1950 to 2015
Fig. 5. Range of variation of per unit area cotton yield in China from 1950 to 2015
Fig. 6. Comparison of standard deviation ellipse of cotton yields (a) and planting area (b) in China from 1950 to 2015
Fig. 7. Gravity movement of cotton yields and planting area at national level (a), I (b), II (c) and III (d) in China
Fig. 8. Proportions of contribution rates of dominant regions in different yields
|
Table 1. Variation coefficient of cotton production, planting area and per unit area yield in China from 1950 to 2015
|
Table 2. Variation coefficient of cotton production in different planting regions of China from 1950 to 2015
| |||||||||||||||||||||||||||||||||||||||||||||||||||||||||||||||||||||||||
Table 3. Proportions of contribution rates of cotton yields in each dominant region of China in different stages (%)


Set citation alerts for the article
Please enter your email address

© Copyright 2018-2021 | Chinese Laser Press. All Rights Reserved 沪ICP备15018463号-20