• Photonics Research
  • Vol. 7, Issue 3, 265 (2019)
Xingwei Ye1, Fangzheng Zhang1、2、*, Yue Yang1, and Shilong Pan1、3、*
Author Affiliations
  • 1Key Laboratory of Radar Imaging and Microwave Photonics, Ministry of Education, Nanjing University of Aeronautics and Astronautics, Nanjing 210016, China
  • 2e-mail: zhangfangzheng@nuaa.edu.cn
  • 3e-mail: pans@nuaa.edu.cn
  • show less
    DOI: 10.1364/PRJ.7.000265 Cite this Article Set citation alerts
    Xingwei Ye, Fangzheng Zhang, Yue Yang, Shilong Pan. Photonics-based radar with balanced I/Q de-chirping for interference-suppressed high-resolution detection and imaging[J]. Photonics Research, 2019, 7(3): 265 Copy Citation Text show less
    Schematic diagram of the proposed photonics-based radar. LD, laser diode; ESG, electrical signal generator; OC, optical coupler; MZM, Mach–Zehnder modulator; OBPF, optical bandpass filter; PA, power amplifier; LNA, low-noise amplifier; PD/BPD, (balanced) photodetector; ADC, analog-to-digital conversion; DSP, digital signal processing. (Insets, optical spectra at several key points in the system.)
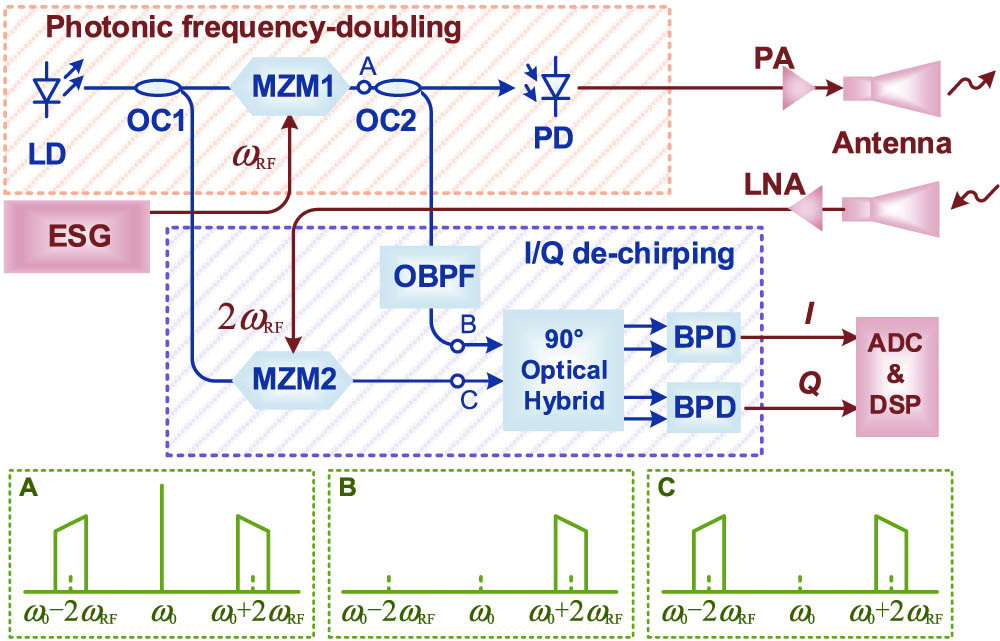
    Fig. 1. Schematic diagram of the proposed photonics-based radar. LD, laser diode; ESG, electrical signal generator; OC, optical coupler; MZM, Mach–Zehnder modulator; OBPF, optical bandpass filter; PA, power amplifier; LNA, low-noise amplifier; PD/BPD, (balanced) photodetector; ADC, analog-to-digital conversion; DSP, digital signal processing. (Insets, optical spectra at several key points in the system.)
    Optical spectra at several key points in the proposed photonic radar. Dotted blue line, output of the MZM in the transmitter (point A); solid red line, output of the OBPF (point B); dashed green line, output of the MZM in the receiver (point C).
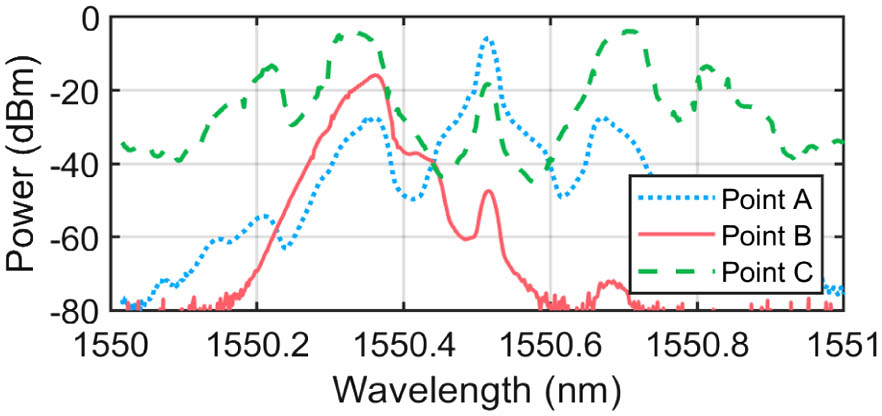
    Fig. 2. Optical spectra at several key points in the proposed photonic radar. Dotted blue line, output of the MZM in the transmitter (point A); solid red line, output of the OBPF (point B); dashed green line, output of the MZM in the receiver (point C).
    Spectrograms of the signals (a) before and (b) after the photonic frequency doubling in the transmitter. The power profiles are projected to the time and frequency domains.
    Fig. 3. Spectrograms of the signals (a) before and (b) after the photonic frequency doubling in the transmitter. The power profiles are projected to the time and frequency domains.
    Comparison between the de-chirped signals obtained by single-end PD (SPD, dotted blue line) and BPD (solid red line), including time-domain waveforms of (a) the I channel and (b) the Q channel, and the corresponding spectra of (c) the I channel and (d) the Q channel by FFT.
    Fig. 4. Comparison between the de-chirped signals obtained by single-end PD (SPD, dotted blue line) and BPD (solid red line), including time-domain waveforms of (a) the I channel and (b) the Q channel, and the corresponding spectra of (c) the I channel and (d) the Q channel by FFT.
    Results of the photonic I/Q radar receiver. (a) Zoom-in view of the captured waveforms; (b) spectra of the real de-chirped signal from the I channel and the combined complex de-chirped signal; (c) and (d) zoom-in views of the spectra around the peaks for indicating the range resolution of the proposed photonic radar.
    Fig. 5. Results of the photonic I/Q radar receiver. (a) Zoom-in view of the captured waveforms; (b) spectra of the real de-chirped signal from the I channel and the combined complex de-chirped signal; (c) and (d) zoom-in views of the spectra around the peaks for indicating the range resolution of the proposed photonic radar.
    (a) and (b) Experimental setup, and (c)–(e) results of the ISAR demonstration.
    Fig. 6. (a) and (b) Experimental setup, and (c)–(e) results of the ISAR demonstration.
    ISAR imaging results when using a laser source with (a) <2-fm wavelength dither and (b) 800-fm wavelength dither.
    Fig. 7. ISAR imaging results when using a laser source with (a) <2-fm wavelength dither and (b) 800-fm wavelength dither.
    Simulated results on the FoM of the image with different laser wavelength dithers and different uncompensated differential delays between two branches. The hyperbolic fit of the contour line at 0.5, which is considered as the threshold of the acceptable imaging, is plotted as the dotted blue line. Images under four typical conditions at points A, B, C, and D are also depicted as the insets.
    Fig. 8. Simulated results on the FoM of the image with different laser wavelength dithers and different uncompensated differential delays between two branches. The hyperbolic fit of the contour line at 0.5, which is considered as the threshold of the acceptable imaging, is plotted as the dotted blue line. Images under four typical conditions at points A, B, C, and D are also depicted as the insets.
    Xingwei Ye, Fangzheng Zhang, Yue Yang, Shilong Pan. Photonics-based radar with balanced I/Q de-chirping for interference-suppressed high-resolution detection and imaging[J]. Photonics Research, 2019, 7(3): 265
    Download Citation