Author Affiliations
1Key Laboratory of Smart City and Environmental Modeling of Higher Education Institute, College of Resources and Environment Sciences, Xinjiang University, Urumqi, Xinjiang 830046, China2Key Laboratory of Oasis Ecology, Urumqi, Xinjiang 830046, China3Engineering research center of Central Asia Geoinformation development and utilization, National administration of surveying, Mapping and Geoinformation, Urumqi, Xinjiang 830046, Chinashow less
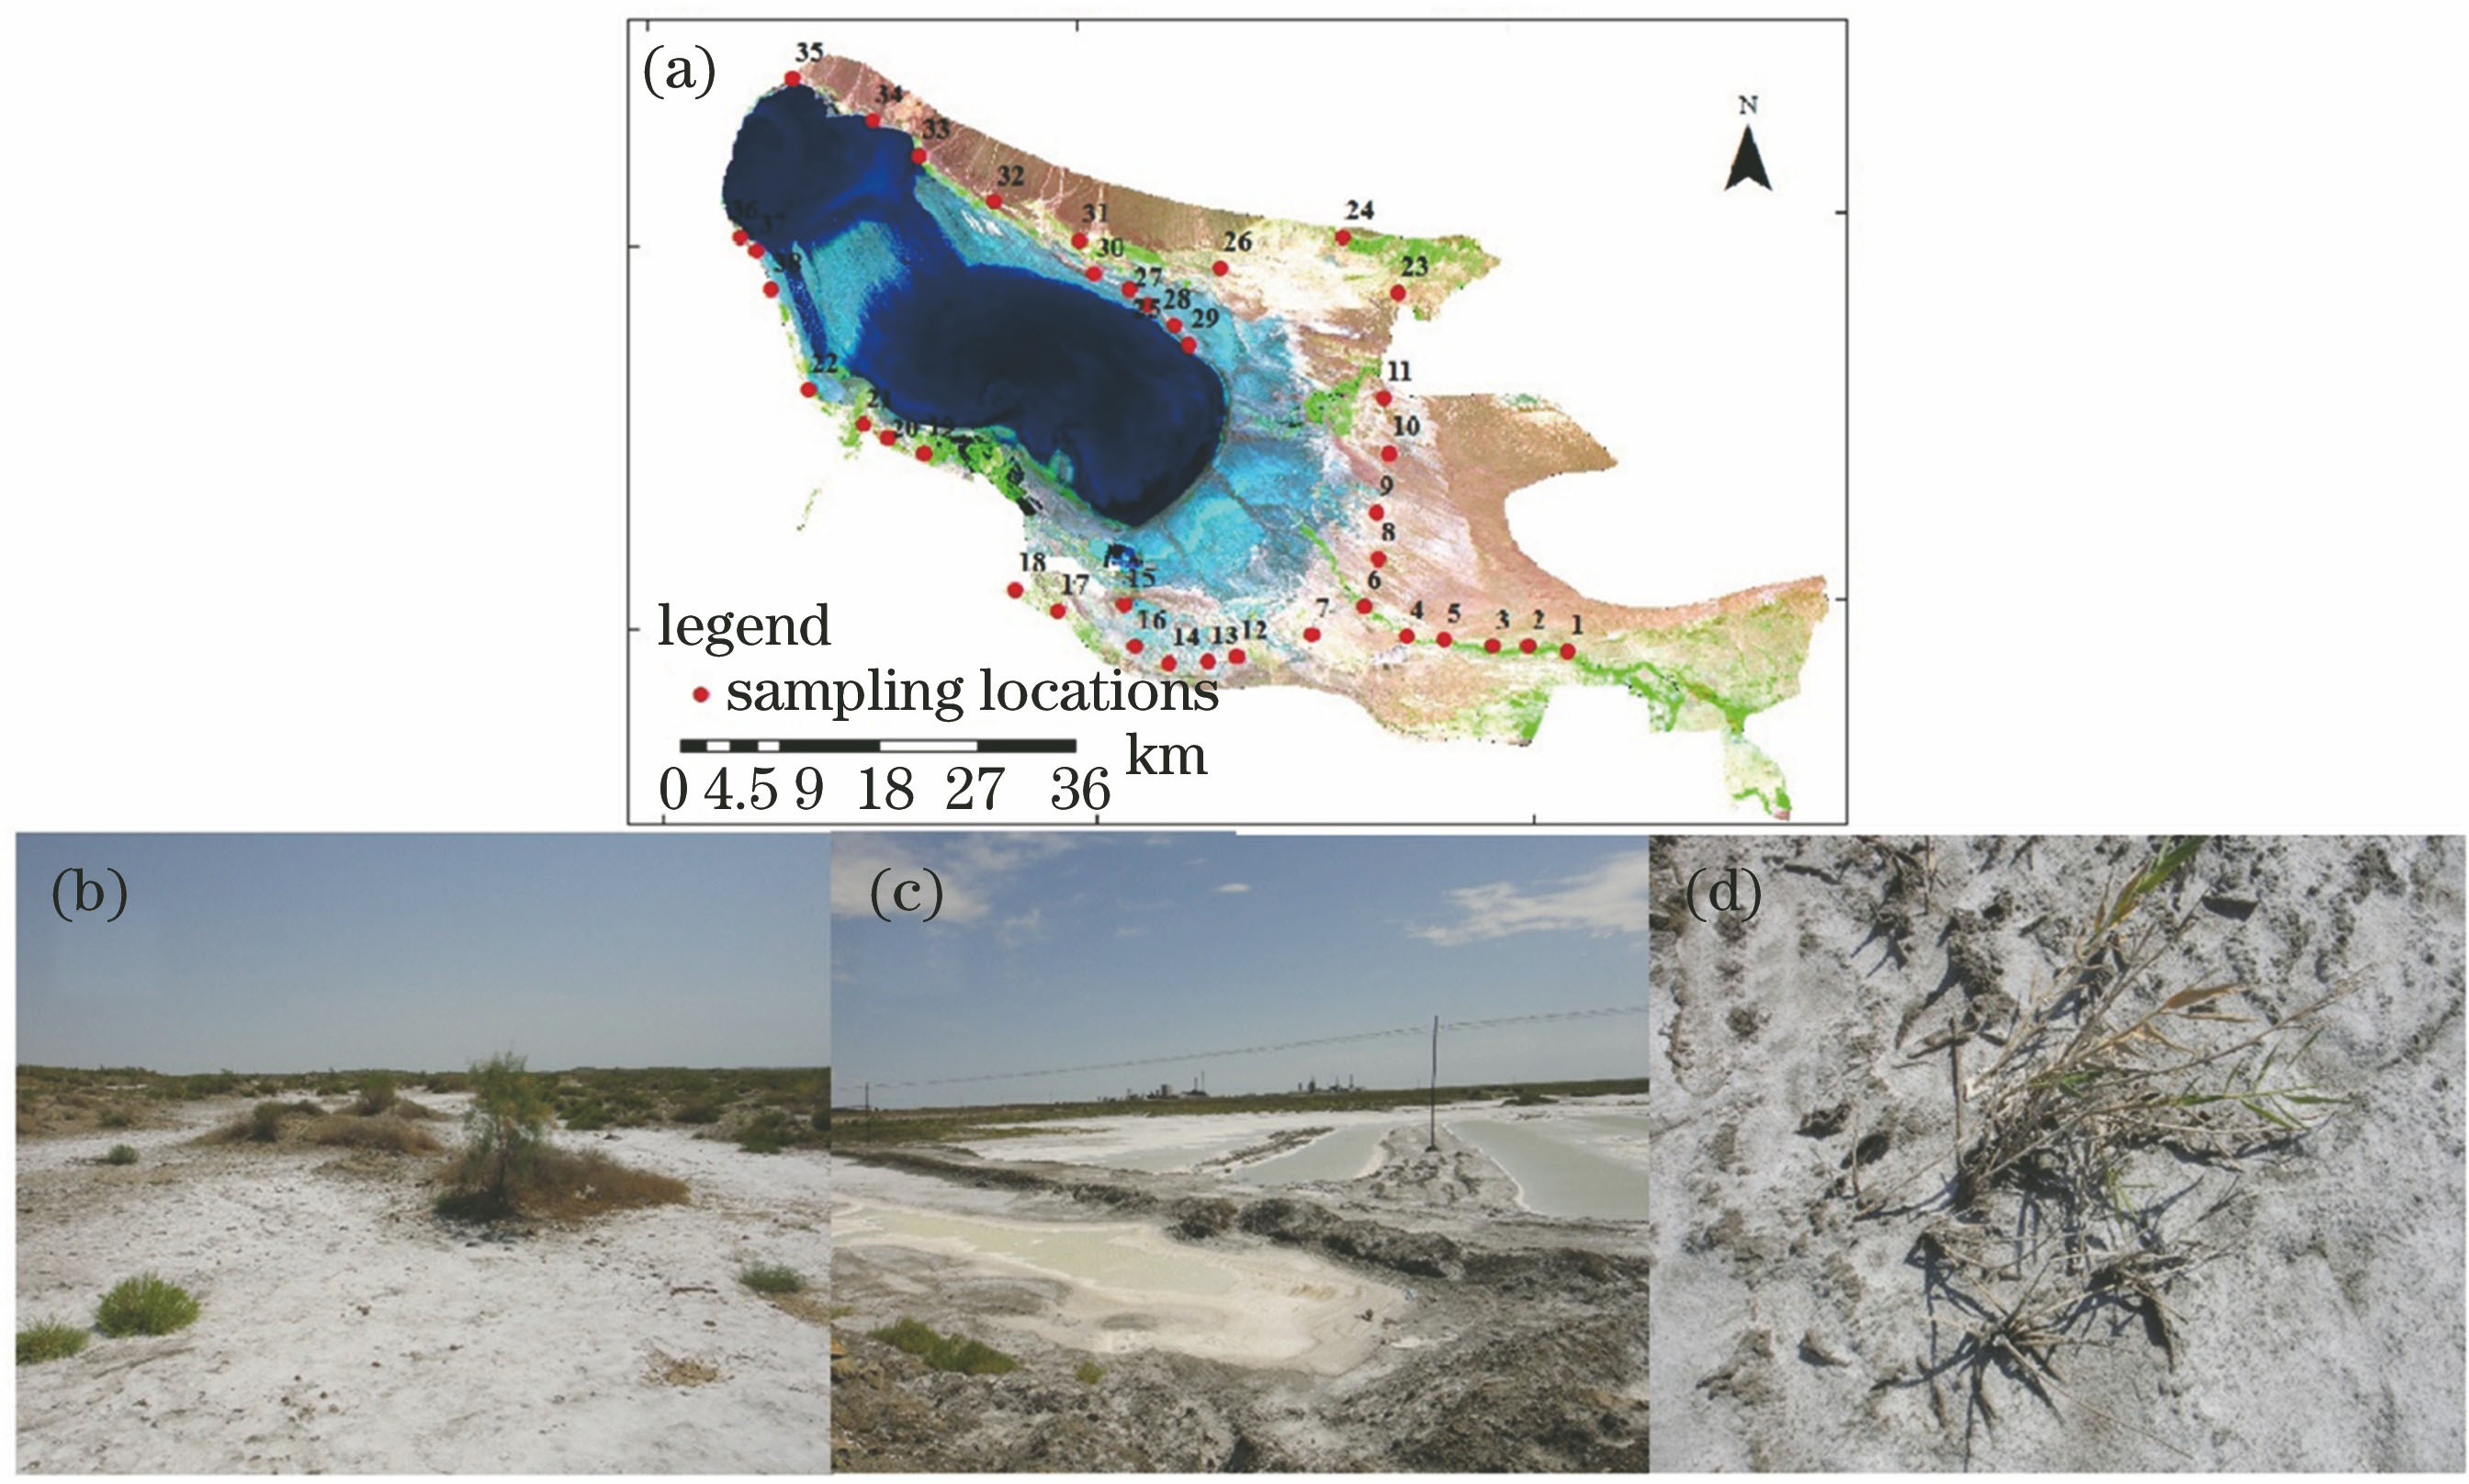
Fig. 1. Schematic of research area. (a) Ebinur Lake Wetland Reserve and distribution of sampling points; (b) salinized soil in Ebinur Lake Wetland Reserve; (c) salt crystals on surface of ponds in Ebinur Lake Wetland Reserve; (d) vegetation in Ebinur Lake Wetland Reserve
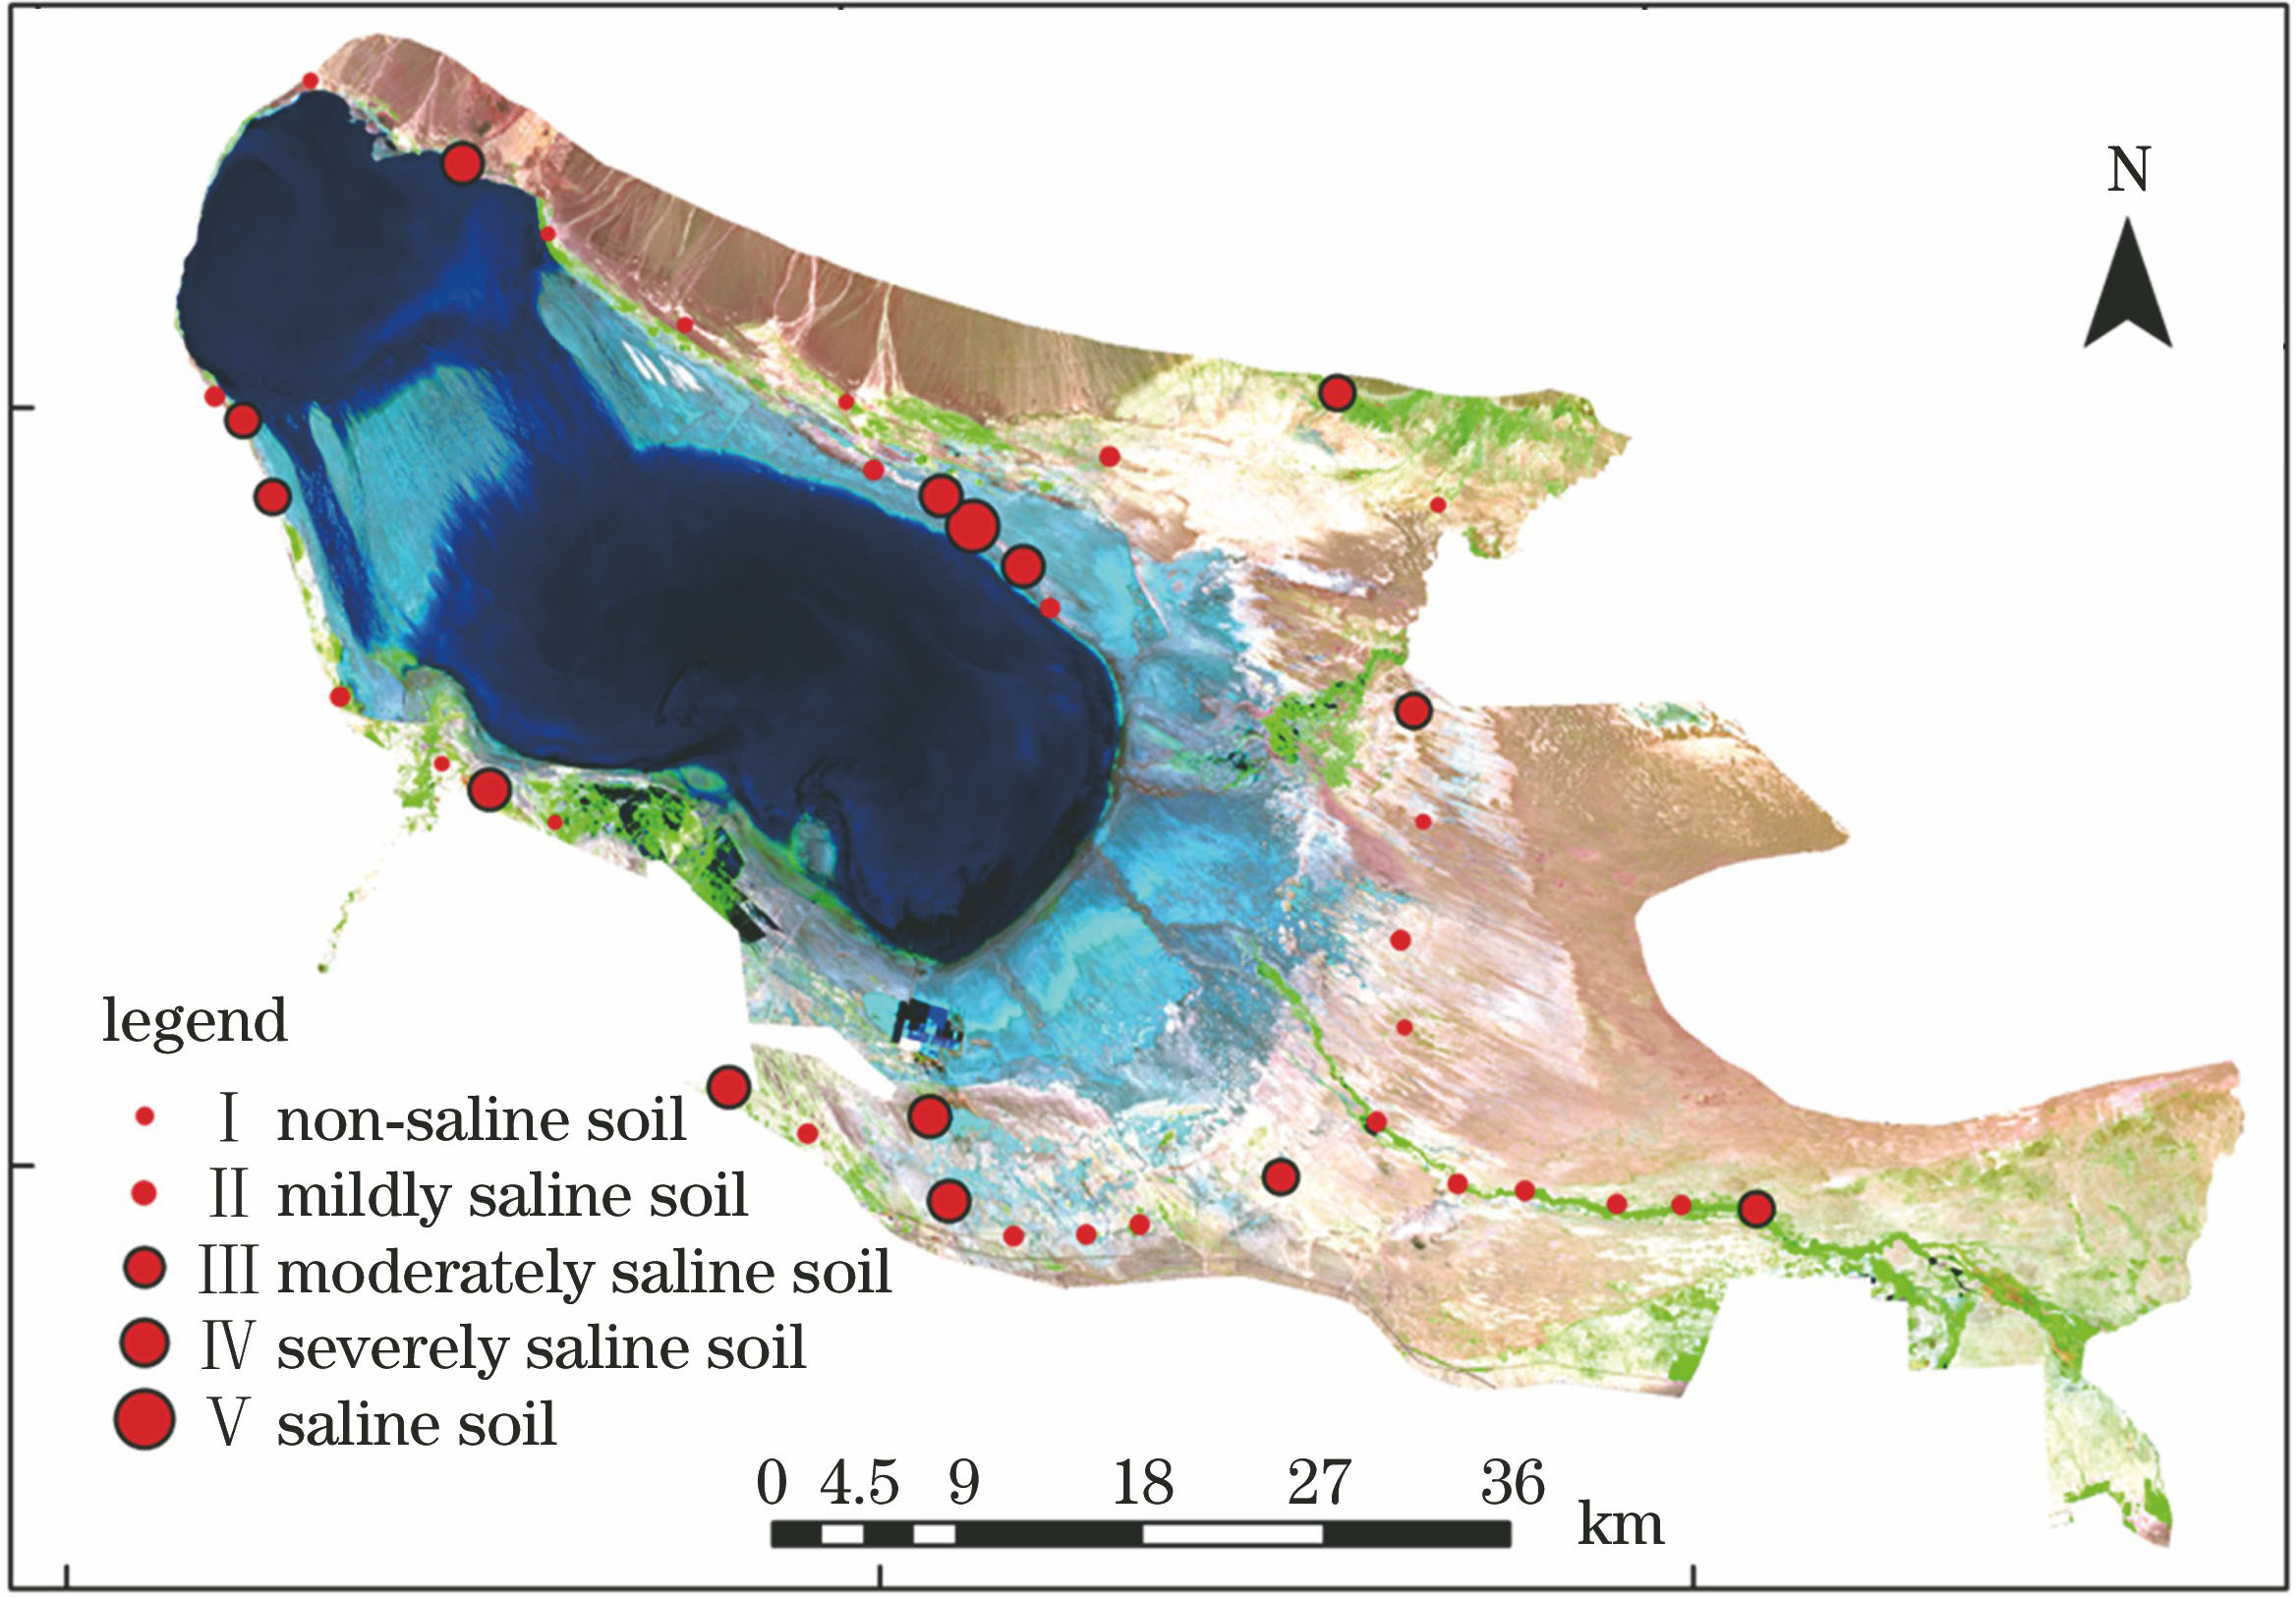
Fig. 2. Matic map of salinization degree of sampling points
Fig. 3. Schematic of classification process of SVMs
Fig. 4. Images processed by different filtering methods. (a) Raw remote-sensing image; (b) Laplacian filtering; (c) high-pass filtering; (d) low-pass filtering; (e) Gaussian high-pass filtering; (f) Gaussian low-pass filtering; (g) median filtering; (h) directional filtering
Fig. 5. Variation in brightness value at different bands
Fig. 6. Classification of remote-sensing images based on different filtering methods. (a) Raw remote-sensing image; (b) Laplacian filtering; (c) high-pass filtering; (d) low-pass filtering; (e) Gaussian high-pass filtering; (f) Gaussian low-pass filtering; (g) median filtering; (h) directional filtering
| Degree ofsoil salinization | Soil saltcontent /(g·kg-1) | Numberof samples | Growth condition |
|---|
| Non-saline soil | <1 | 10 | Healthy growth of vegetation | | Mildly saline soil | 1--6 | 15 | Plant coverage is approximately 15% to 30%,and salt-sensitive vegetation may be affected | | Moderately saline soil | 6--10 | 6 | Plant coverage isapproximately 10% to 15%,and salt-tolerant crops are less affected | | Severely saline soil | 10--20 | 6 | Plant coverage is approximately 5% to 10%,and salt-tolerant crops and their yields are greatly affected | | Saline soil | >20 | 1 | There is only a small amount of salt-tolerantvegetation such as Haloxylon ammodendron |
|
Table 1. Classification of degree of soil salinization
| Filtering | Filtering matrix |
|---|
| Laplacian | | | High-pass | | | Low-pass | | | Gaussianhigh-pass | | | Gaussianlow-pass | | | Median | | | Directional | |
|
Table 2. Filtering matrix functions
| Classificationtype | Soil saltcontent /(g·kg-1) | Typicalarea | Description |
|---|
| Water body | - | | The color of the water on thefalse color image is blue or black,including rivers, ditches, lakes, etc. | | Non-saline soil | <1 | | The soil has low salt content andlow image reflectance, includingrocks, wasteland, mountains, etc. | | Mildly saline soil | 1--6 | | The soil has less salt content, and thevegetation coverage is about 8%~15%The white patches in the middle of thevegetation and the bright spot area are small | | Moderately saline soil | 6--10 | | The soil has a general salt content,vegetation coverage is about 1% to 8%, andthere are fewer white patches on the image | | Severely saline soil | 10--20 | | The soil has a high salt contentand is a heavily salinizedarea in the Ebinur Lake region | | Saline soil | >20 | | The soil has high salt content, high spectralreflectance, obvious salt crust on the surface,white plaque distribution on the image,and basically no vegetation growth |
|
Table 3. Classification scheme of remote-sensing image of research area
| Filtering | Overallaccuracy /% | Kappacoefficient /% |
|---|
| Raw remotesensing image | 86.7285 | 82.21 | | High-pass | 87.0441 | 82.65 | | Low-pass | 89.6555 | 86.15 | | Laplacian | 88.6544 | 84.80 | | Directional | 88.8714 | 85.10 | | Gaussian high-pass | 89.6950 | 86.20 | | Gaussian low-pass | 89.6087 | 86.58 | | Median | 89.6678 | 86.16 |
|
Table 4. Assessment methods of classification accuracy of SVM