• Photonics Research
  • Vol. 8, Issue 7, 1203 (2020)
Jiafeng Lu1, Fan Shi1, Linghao Meng1, Longkun Zhang1, Linping Teng1, Zhengqian Luo2, Peiguang Yan3, Fufei Pang1、4, and Xianglong Zeng1、*
Author Affiliations
  • 1Key Laboratory of Specialty Fiber Optics and Optical Access Networks, Joint International Research Laboratory of Specialty Fiber Optics and Advanced Communication, Shanghai University, Shanghai 200444, China
  • 2Department of Electronic Engineering, School of Information Science and Engineering, Xiamen University, Xiamen 361005, China
  • 3Shenzhen Key Laboratory of Laser Engineering, Shenzhen University, Shenzhen 518060, China
  • 4e-mail: ffpang@shu.edu.cn
  • show less
    DOI: 10.1364/PRJ.386954 Cite this Article Set citation alerts
    Jiafeng Lu, Fan Shi, Linghao Meng, Longkun Zhang, Linping Teng, Zhengqian Luo, Peiguang Yan, Fufei Pang, Xianglong Zeng. Real-time observation of vortex mode switching in a narrow-linewidth mode-locked fiber laser[J]. Photonics Research, 2020, 8(7): 1203 Copy Citation Text show less
    Diagram of an AOMC and the simulation of the switching mechanism based on optical and acoustic birefringence. (a) The schematic diagram of the dual-resonant AOMC and the mode-switching mechanism. (b) The setup of an AOMC component. (c) The schematic diagram of the fiber end face. (d) The simulation of beat lengths between the LP01 mode and LP11a/b modes with different ellipticities of the fiber core. The straight lines and dash lines represent the beat lengths from the LP01 mode to the LP11a and LP11b modes, respectively. (e) The Δλ shifts with the decrease of ellipticity of fiber core. The inset figure shows the wavelength separation in the transmission spectrum of a dual-resonant AOMC.
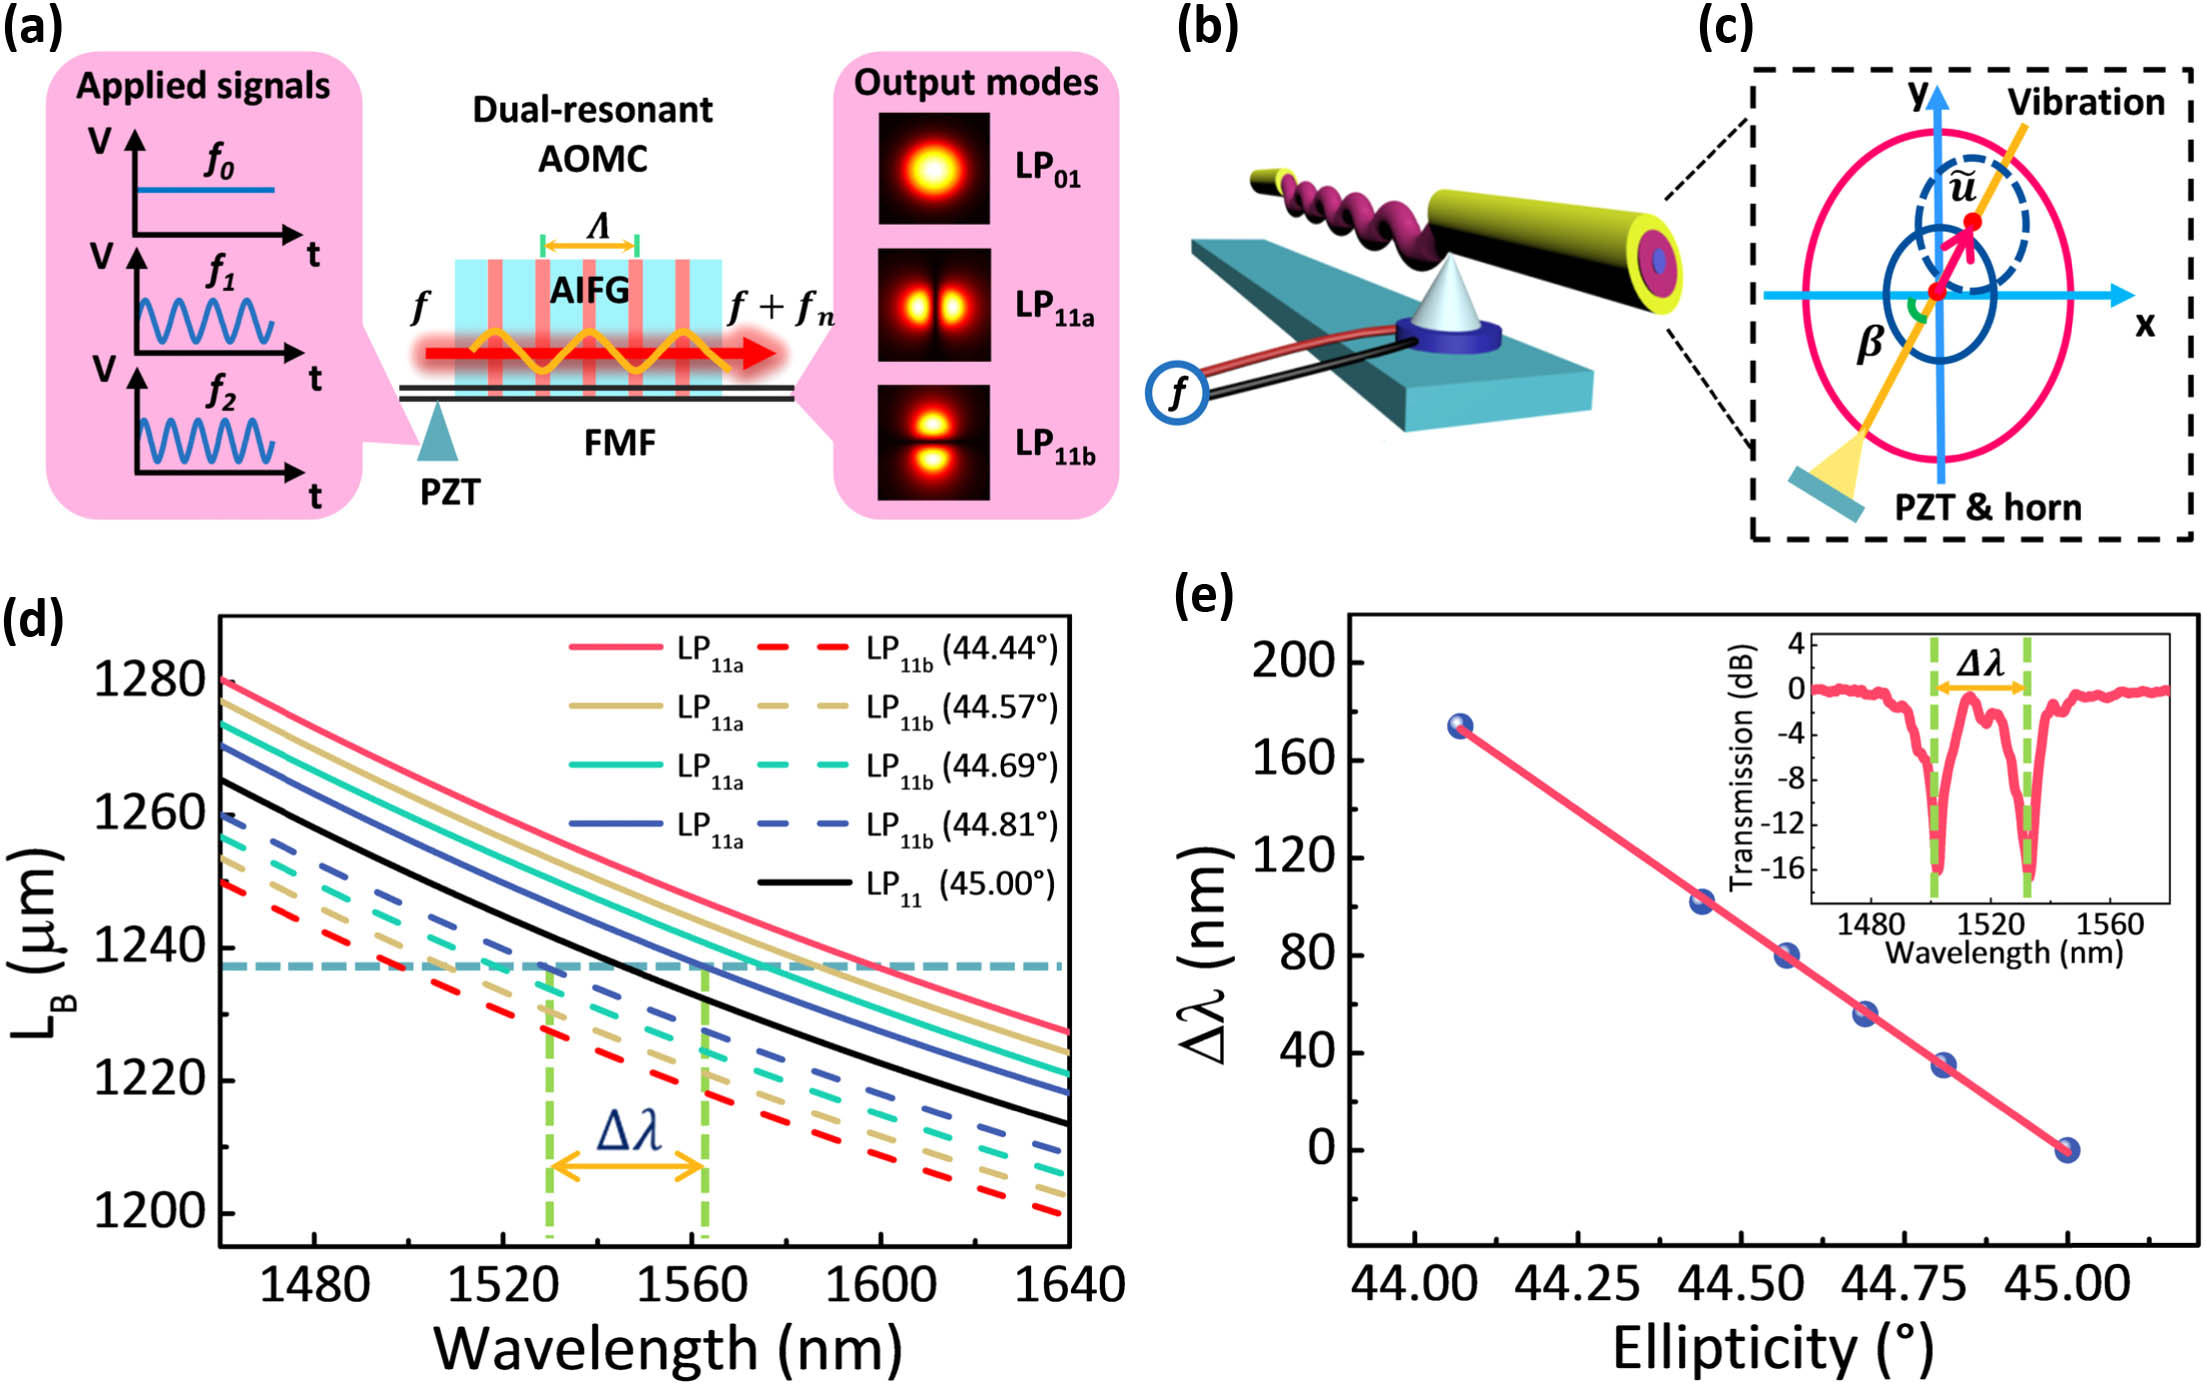
    Fig. 1. Diagram of an AOMC and the simulation of the switching mechanism based on optical and acoustic birefringence. (a) The schematic diagram of the dual-resonant AOMC and the mode-switching mechanism. (b) The setup of an AOMC component. (c) The schematic diagram of the fiber end face. (d) The simulation of beat lengths between the LP01 mode and LP11a/b modes with different ellipticities of the fiber core. The straight lines and dash lines represent the beat lengths from the LP01 mode to the LP11a and LP11b modes, respectively. (e) The Δλ shifts with the decrease of ellipticity of fiber core. The inset figure shows the wavelength separation in the transmission spectrum of a dual-resonant AOMC.
    (a) Transmission spectra of the AOMC with two different applied signal frequencies of 726 kHz and 742 kHz. (b) The frequency shift performance of the applied dual-resonant AOMC.
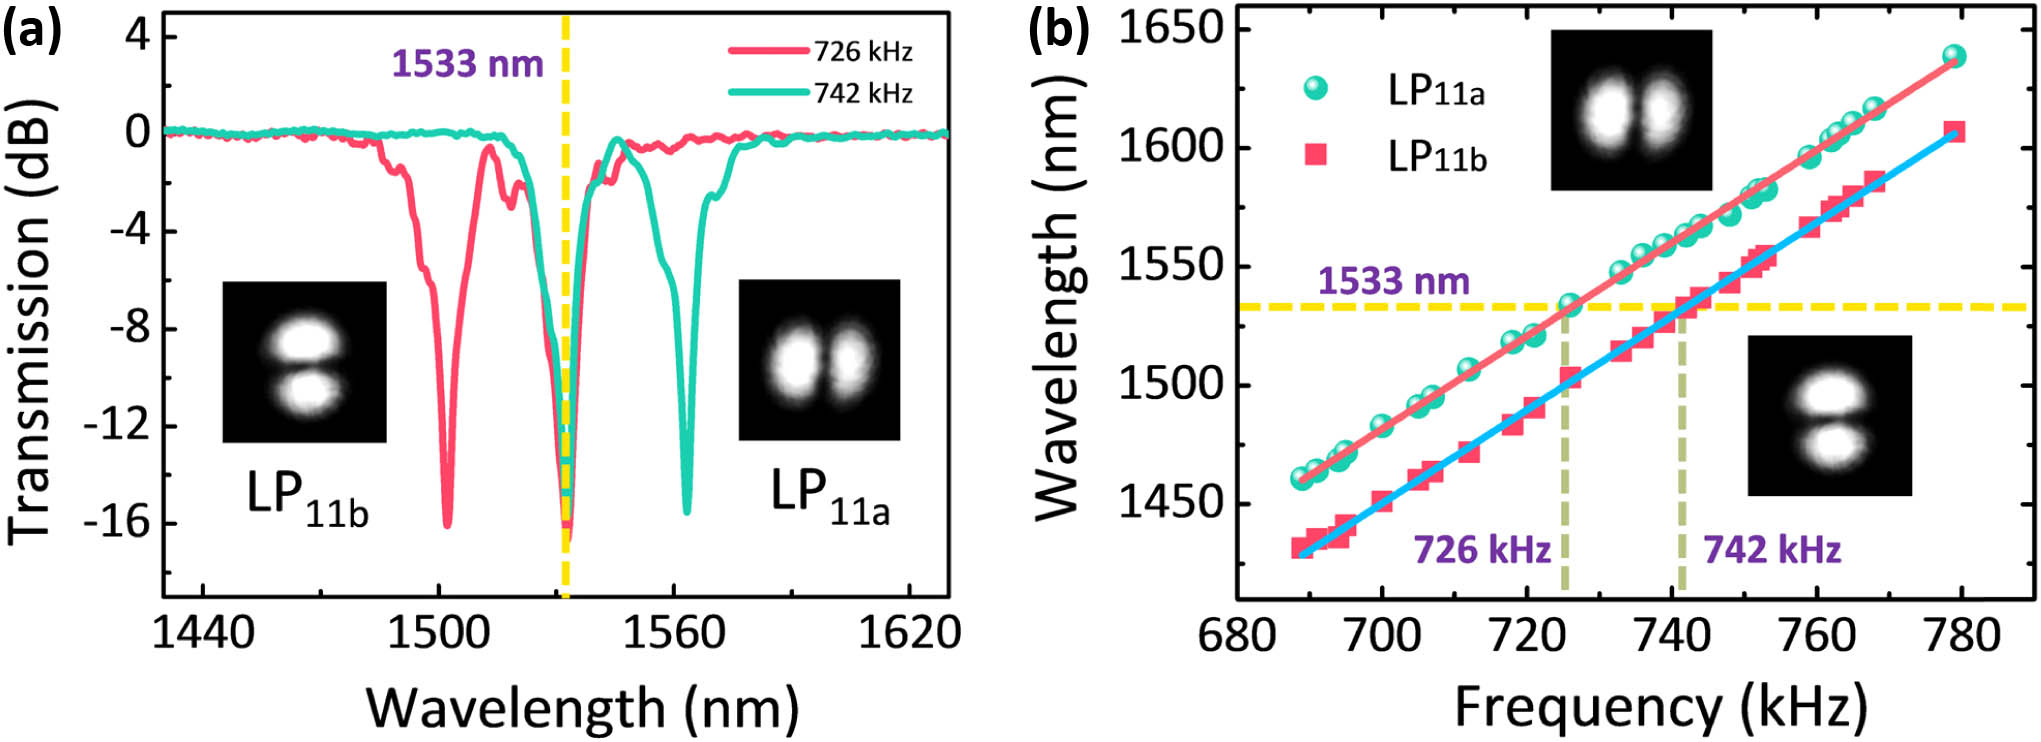
    Fig. 2. (a) Transmission spectra of the AOMC with two different applied signal frequencies of 726 kHz and 742 kHz. (b) The frequency shift performance of the applied dual-resonant AOMC.
    Experimental setup and results of spatial mode switching in a mode-locked fiber laser. (a) The schematic diagram of the spatial mode switching fiber laser setup. OSA, optical spectrum analyzer; WDM, wavelength-division multiplexer; PC, polarization controller; MS, mode stripper. The stable ML with three different mode states: (b) OAM0, (c) OAM+1, and (d) OAM−1. The results include laser spectra, pulse trains, and RF signals (see spatial mode-switching processes of LP01–LP11a, LP01–LP11b, LP11a–LP11b, and OAM+1–OAM−1 in Visualization 1, Visualization 2, Visualization 3, and Visualization 4, respectively).
    Fig. 3. Experimental setup and results of spatial mode switching in a mode-locked fiber laser. (a) The schematic diagram of the spatial mode switching fiber laser setup. OSA, optical spectrum analyzer; WDM, wavelength-division multiplexer; PC, polarization controller; MS, mode stripper. The stable ML with three different mode states: (b) OAM0, (c) OAM+1, and (d) OAM1. The results include laser spectra, pulse trains, and RF signals (see spatial mode-switching processes of LP01LP11a, LP01LP11b, LP11aLP11b, and OAM+1OAM1 in Visualization 1, Visualization 2, Visualization 3, and Visualization 4, respectively).
    Output results of the mode-switching mode-locked fiber laser. (a) The mode patterns recorded by a CCD include the (a1) mode intensity pattern and (a2) interference pattern of the OAM0 mode; (a3), (a4) LP11 mode intensity patterns, (a5), (a6) donut mode patterns; and (a7), (a8) interference patterns of the OAM+1 and OAM−1 modes. (b) The real-time pulse shapes of three OAM modes. (c) The slope efficiencies of the mode-locked fiber laser with three OAM mode states.
    Fig. 4. Output results of the mode-switching mode-locked fiber laser. (a) The mode patterns recorded by a CCD include the (a1) mode intensity pattern and (a2) interference pattern of the OAM0 mode; (a3), (a4) LP11 mode intensity patterns, (a5), (a6) donut mode patterns; and (a7), (a8) interference patterns of the OAM+1 and OAM1 modes. (b) The real-time pulse shapes of three OAM modes. (c) The slope efficiencies of the mode-locked fiber laser with three OAM mode states.
    Real-time information of mode-switching dynamics. (a) The real-time information of the whole mode-switching dynamic process among three vortex modes (OAM0, OAM−1, and OAM+1). The detailed information of the strike regions named as (b) I, II and (c) III–VI.
    Fig. 5. Real-time information of mode-switching dynamics. (a) The real-time information of the whole mode-switching dynamic process among three vortex modes (OAM0, OAM1, and OAM+1). The detailed information of the strike regions named as (b) I, II and (c) IIIVI.
    Experimental observation of vortex mode switching from the OAM+1 mode to the OAM0 mode via the TS-DFT method. (a) The energy envelope evolution of the DFT signal. (b) The whole spectrum evolution of the vortex mode-switching dynamics with closeup pictures of (b1) initial ML, (b2) laser spikes, and (b3) wavelength shift. Comparisons of DFT signals and optical spectra of the (c1) OAM+1 mode and (c2) OAM0 mode (see the dynamic single-shot spectrum evolution in Visualization 5).
    Fig. 6. Experimental observation of vortex mode switching from the OAM+1 mode to the OAM0 mode via the TS-DFT method. (a) The energy envelope evolution of the DFT signal. (b) The whole spectrum evolution of the vortex mode-switching dynamics with closeup pictures of (b1) initial ML, (b2) laser spikes, and (b3) wavelength shift. Comparisons of DFT signals and optical spectra of the (c1) OAM+1 mode and (c2) OAM0 mode (see the dynamic single-shot spectrum evolution in Visualization 5).
    Jiafeng Lu, Fan Shi, Linghao Meng, Longkun Zhang, Linping Teng, Zhengqian Luo, Peiguang Yan, Fufei Pang, Xianglong Zeng. Real-time observation of vortex mode switching in a narrow-linewidth mode-locked fiber laser[J]. Photonics Research, 2020, 8(7): 1203
    Download Citation