
Bing HUANG, Xiao-hong WANG, Ping JIANG. Research on Detection of Cement Raw Material Content Based on Near-Infrared Spectroscopy[J]. Spectroscopy and Spectral Analysis, 2022, 42(3): 737
- Spectroscopy and Spectral Analysis
- Vol. 42, Issue 3, 737 (2022)
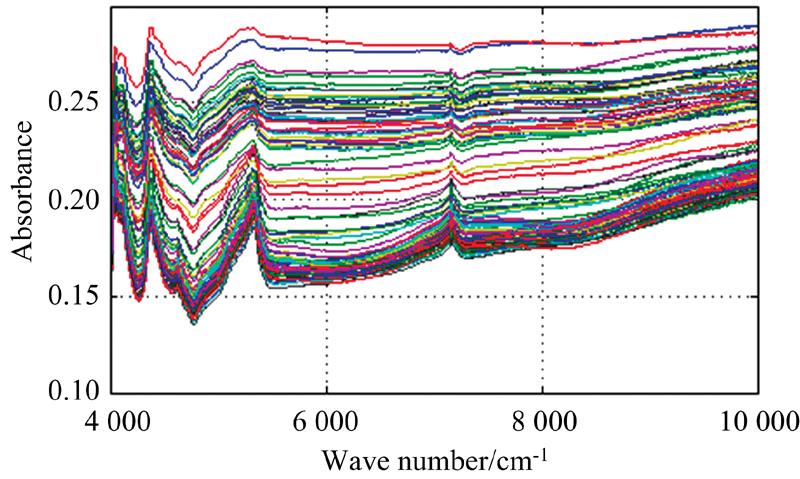
Fig. 1. Near infrared spectra of raw material samples from Qufu
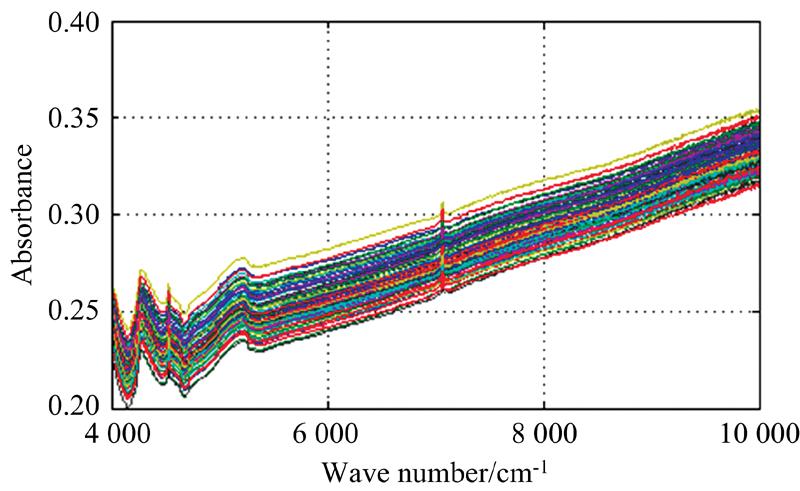
Fig. 2. Near infrared spectra of raw material samples from Linyi
Fig. 3. Qufu SiO2 sample band selection by CARS
(a): Band selection process sample changes; (b): RMSECV variation in band selection process; (c): Change in regression coeffient of band selection process
(a): Band selection process sample changes; (b): RMSECV variation in band selection process; (c): Change in regression coeffient of band selection process
Fig. 4. Qufu SiO2 sample band selection
Fig. 5. Linyi SiO2 sample band selection
Fig. 6. Qufu Al2O3sample band selection
Fig. 7. Linyi Al2O3sample band selection
Fig. 8. Qufu Fe2O3sample band selection
Fig. 9. Linyi Fe2O3sample band selection
Fig. 10. Qufu CaOsample band selection
Fig. 11. Qufu CaOsample band selection
| ||||||||||||||||||||||||||||||||||||||||||
Table 1. Content distribution table of raw materials from Qufu and Linyi
| |||||||||||||||||||||||||||||||||||||||||||||||||||||||||||||||||||||||||||||||||||||||||||||||
Table 2. Qufu sample partition
| |||||||||||||||||||||||||||||||||||||||||||||||||||||||||||||||||||||||||||||||||||||||||||||||
Table 3. Linyi sample partition
| |||||||||||||||||||||||||||||||||||||||||
Table 4. Qufu and Linyi raw material near infrared spectrum global PLS modeling results
| ||||||||||||||||||||||||||||||||||||||||||||||||||||||
Table 5. Qufu and Linyi cement raw meal near infrared spectrum local PLS modeling results table

Set citation alerts for the article
Please enter your email address
© Copyright 2018-2021 | Chinese Laser Press. All Rights Reserved 沪ICP备15018463号-20