• Photonics Research
  • Vol. 7, Issue 11, 1314 (2019)
Leonid L. Doskolovich1、2、†, Evgeni A. Bezus1、2、†,*, and Dmitry A. Bykov1、2
Author Affiliations
  • 1Image Processing Systems Institute—Branch of the Federal Scientific Research Centre “Crystallography and Photonics” of Russian Academy of Sciences, Samara 443001, Russia
  • 2Samara National Research University, Samara 443086, Russia
  • show less
    DOI: 10.1364/PRJ.7.001314 Cite this Article Set citation alerts
    Leonid L. Doskolovich, Evgeni A. Bezus, Dmitry A. Bykov. Integrated flat-top reflection filters operating near bound states in the continuum[J]. Photonics Research, 2019, 7(11): 1314 Copy Citation Text show less
    Geometry of a ridge on a (a) waveguide layer and of a (b) composite structure consisting of three ridges separated by phase-shift regions. Red arrows indicate the propagation directions of the incident wave I, reflected wave R, and transmitted wave T.
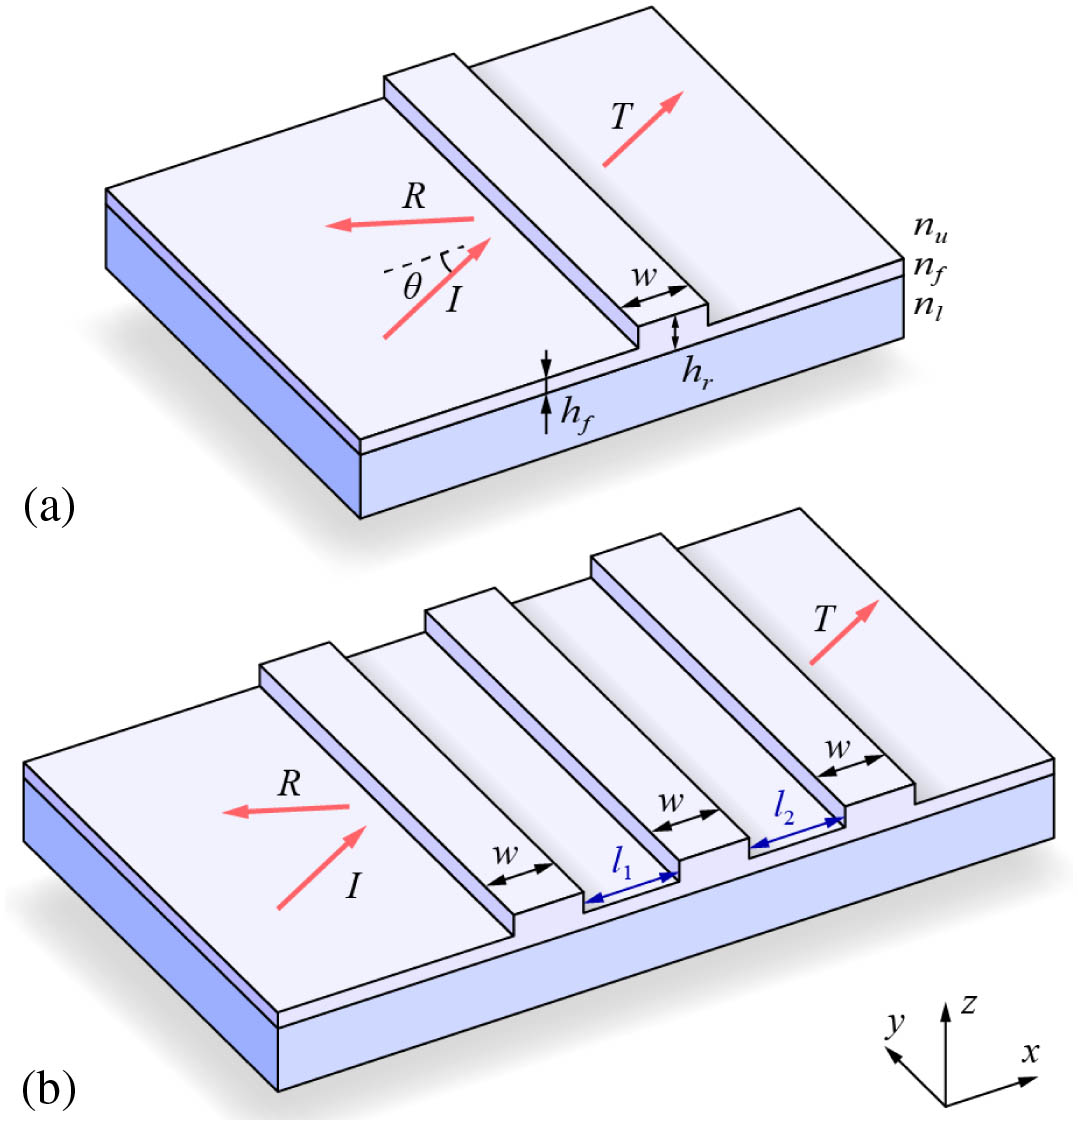
    Fig. 1. Geometry of a ridge on a (a) waveguide layer and of a (b) composite structure consisting of three ridges separated by phase-shift regions. Red arrows indicate the propagation directions of the incident wave I, reflected wave R, and transmitted wave T.
    Reflectance of an obliquely incident TE-polarized guided mode with free-space wavelength λ0=630 nm from the ridge versus ridge width w and angle of incidence θ. The white circle indicates the BIC position. White dashed lines indicate the ridge widths, at which the angular spectra in Fig. 3(a) are plotted.
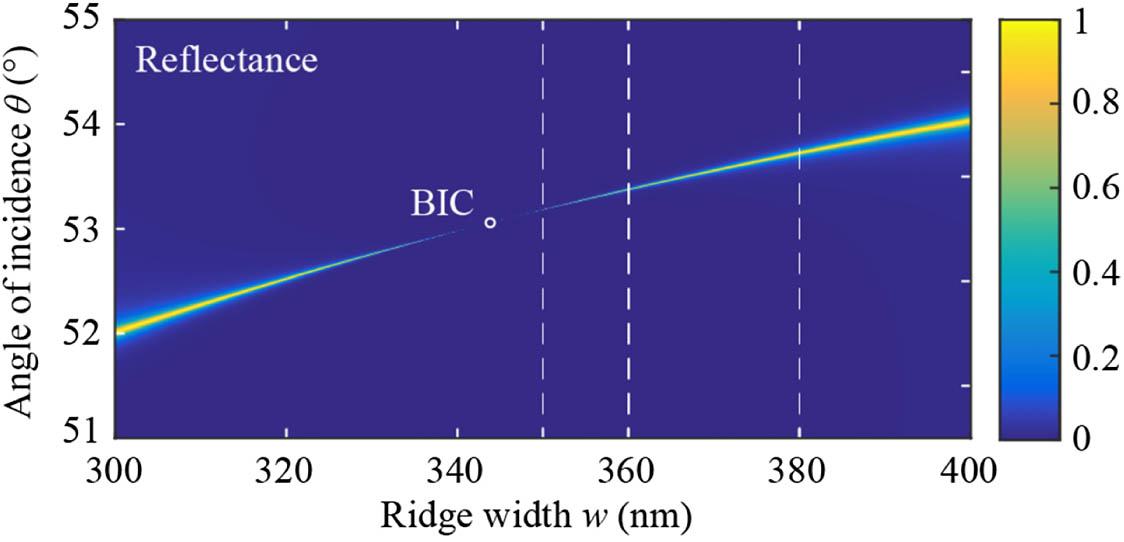
    Fig. 2. Reflectance of an obliquely incident TE-polarized guided mode with free-space wavelength λ0=630  nm from the ridge versus ridge width w and angle of incidence θ. The white circle indicates the BIC position. White dashed lines indicate the ridge widths, at which the angular spectra in Fig. 3(a) are plotted.
    (a) Angular and (b) wavelength ridge reflectance spectra at w=355 nm (solid blue lines), w=360 nm (dashed red lines), and w=380 nm (dotted yellow lines). The angular spectra are calculated at the fixed free-space wavelength of 630 nm and are the cross sections of the reflectance distribution in Fig. 2 along the white dashed lines. The wavelength spectra are calculated at the angles of incidence θ1=53.28° (w=355 nm), θ2=53.37° (w=360 nm), and θ3=53.72° (w=380 nm), at which the resonant peaks are centered at λ=λ0=630 nm.
    Fig. 3. (a) Angular and (b) wavelength ridge reflectance spectra at w=355  nm (solid blue lines), w=360  nm (dashed red lines), and w=380  nm (dotted yellow lines). The angular spectra are calculated at the fixed free-space wavelength of 630 nm and are the cross sections of the reflectance distribution in Fig. 2 along the white dashed lines. The wavelength spectra are calculated at the angles of incidence θ1=53.28° (w=355  nm), θ2=53.37° (w=360  nm), and θ3=53.72° (w=380  nm), at which the resonant peaks are centered at λ=λ0=630  nm.
    Transmittance (black) and reflectance (red) spectra of composite structures consisting of (a) N=2, (b) N=4, and (c) N=6 ridges at the ridge width w=380 nm and the distance between the ridges l=948 nm (solid lines). Dashed lines show the spectra of a single ridge.
    Fig. 4. Transmittance (black) and reflectance (red) spectra of composite structures consisting of (a) N=2, (b) N=4, and (c) N=6 ridges at the ridge width w=380  nm and the distance between the ridges l=948  nm (solid lines). Dashed lines show the spectra of a single ridge.
    Transmittance (black) and reflectance (red) spectra of the optimized composite structures consisting of (a) N=4 and (b) N=6 ridges at w=380 nm (solid lines). Dashed lines show the spectra of a single ridge.
    Fig. 5. Transmittance (black) and reflectance (red) spectra of the optimized composite structures consisting of (a) N=4 and (b) N=6 ridges at w=380  nm (solid lines). Dashed lines show the spectra of a single ridge.
    Transmittance (black) and reflectance (red) spectra of the optimized composite structures consisting of (a) N=2, (b) N=4, and (c) N=6 ridges at w=360 nm (solid lines). Dashed lines show the spectra of a single ridge.
    Fig. 6. Transmittance (black) and reflectance (red) spectra of the optimized composite structures consisting of (a) N=2, (b) N=4, and (c) N=6 ridges at w=360  nm (solid lines). Dashed lines show the spectra of a single ridge.
    Reflectance RN(l,λ)=|rN(l,λ)|2 (top) and transmittance TN(l,λ)=|tN(l,λ)|2 (bottom) of the composite structures consisting of (a), (d) N=2, (b), (e) N=3, and (c), (f) N=4 ridges versus the distance between the ridges l and free-space wavelength. Vertical dashed lines show the distance lFP=970.2 nm corresponding to the Fabry–Perot resonance.
    Fig. 7. Reflectance RN(l,λ)=|rN(l,λ)|2 (top) and transmittance TN(l,λ)=|tN(l,λ)|2 (bottom) of the composite structures consisting of (a), (d) N=2, (b), (e) N=3, and (c), (f) N=4 ridges versus the distance between the ridges l and free-space wavelength. Vertical dashed lines show the distance lFP=970.2  nm corresponding to the Fabry–Perot resonance.
    Transmittance spectra of the composite structure consisting of N=3 ridges calculated at the width of the phase-shift region between the ridges l=lFP=970.2 nm corresponding to the BIC condition (solid blue line), and at the widths l=lFP+5 nm=975.2 nm (dashed red line) and l=lFP+10 nm=980.2 nm (dotted yellow line).
    Fig. 8. Transmittance spectra of the composite structure consisting of N=3 ridges calculated at the width of the phase-shift region between the ridges l=lFP=970.2  nm corresponding to the BIC condition (solid blue line), and at the widths l=lFP+5  nm=975.2  nm (dashed red line) and l=lFP+10  nm=980.2  nm (dotted yellow line).
    Leonid L. Doskolovich, Evgeni A. Bezus, Dmitry A. Bykov. Integrated flat-top reflection filters operating near bound states in the continuum[J]. Photonics Research, 2019, 7(11): 1314
    Download Citation