
Sixue Ren, Jingbin Li, Yameng Shi, Baoqin Wen, Xianfei Wang, Liqiao Li. Effect of Process Parameters on Microstructure and Wear Resistance of 20CrMnTi-Based Laser Cladding Ni60A-TiC Coating[J]. Chinese Journal of Lasers, 2023, 50(8): 0802207
- Chinese Journal of Lasers
- Vol. 50, Issue 8, 0802207 (2023)
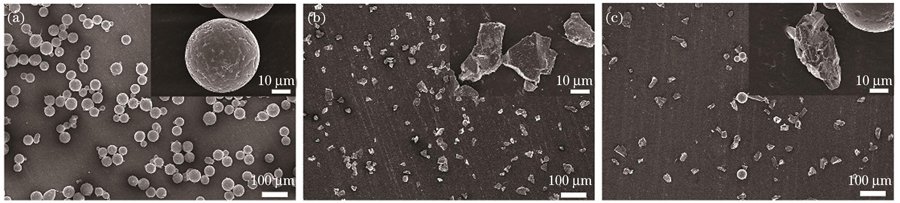
Fig. 1. Morphologies of powders. (a) Ni60A powder; (b) TiC powder; (c) Ni60A-25%TiC composite powder
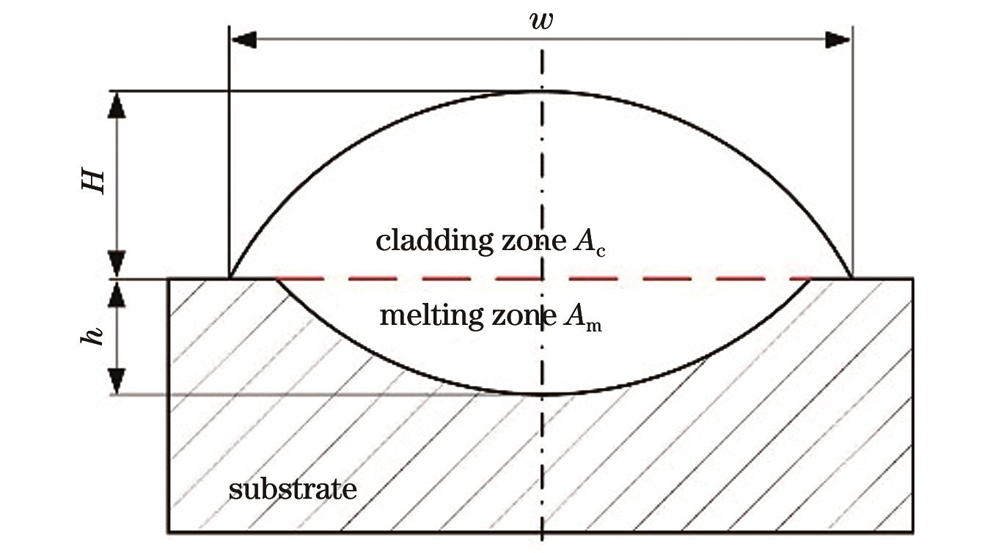
Fig. 2. Schematic of geometrical size of single-track cladding layer
Fig. 3. Sectional morphologies of samples after single-track cladding. (a) S1 sample; (b) S2 sample; (c) S3 sample; (d) S4 sample; (e) S5 sample; (f) S6 sample; (g) S7 sample; (h) S8 sample; (i) S9 sample
Fig. 4. XRD patterns of composite coating. (a) S3 and S5 coatings; (b) S7 and S8 coatings
Fig. 5. Friction coefficient curves, abrasion loss and wear rate of different samples. (a) S1 and S2 samples; (b) S3 and S4 samples; (c) S5 and S6 samples; (d) S7 and S8 samples; (e) S9 and S10 samples; (f) abrasion loss and wear rate
Fig. 6. Three-dimensional worn morphologies of different samples. (a) S1 sample; (b) S2 sample; (c) S3 sample; (d) S4 sample; (e) S5 sample; (f) S6 sample; (g) S7 sample; (h) S8 sample; (i) S9 sample; (j) S10 sample; (k) surface roughness and wear depth
Fig. 7. Microscopic morphologies of worn surface of different samples. (a) S1 sample; (b) S2 sample; (c) S3 sample; (d) S4 sample; (e) S5 sample; (f) S6 sample; (g) S7 sample; (h) S8 sample; (i) S9 sample; (j) S10 sample
Fig. 8. EDS analysis of worn surface. (a) S3 sample; (b) S10 sample
Fig. 9. Cross-sectional EDS analysis of S3 sample
Fig. 10. XPS analysis of S3 sample
| |||||||||||||||||||||||||||||
Table 1. Chemical composition of 20CrMnTi substrate and Ni60A powder
|
Table 2. Factors and levels of orthogonal experiment
|
Table 3. Microhardness of cladding layer surface
|
Table 4. Dilution rate score table
|
Table 5. Microhardness score table
| |||||||||||||||||||||||||||||||||||||||||||||||||||||||||||||||||||||||||||||||||||||||||||||||||||||||||||||||||||||
Table 6. L9(33) orthogonal test results and analysis
|
Table 7. Analysis of variance of comprehensive score


Set citation alerts for the article
Please enter your email address

© Copyright 2018-2021 | Chinese Laser Press. All Rights Reserved 沪ICP备15018463号-20