
Deer Su, Xiangyu Li, Weida Gao, Qiuhua Wei, Haoyu Li, Changliang Guo, Weisong Zhao. Smart palm-size optofluidic hematology analyzer for automated imaging-based leukocyte concentration detection[J]. Opto-Electronic Science, 2023, 2(12): 230018
- Opto-Electronic Science
- Vol. 2, Issue 12, 230018 (2023)
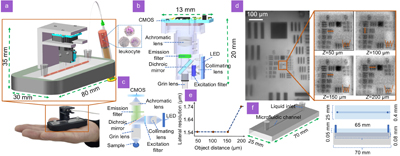
Fig. 1. Principle and construction of the Palm-size Optofluidic Hematology Analyzer. (a ) The photograph and model diagrams of the Palm-size Optofluidic Hematology Analyzer. (b ) The model diagram of a miniature fluorescence microscope. (c ) The optical path design of a miniature fluorescence microscope. (d ) Results of the USAF target at various axial positions imaged by the miniature fluorescence microscope. Z stands for object distance. (e ) The lateral resolution of miniature fluorescence microscope as a function of object distance. (f ) The model diagram of the designed microfluidic chip with top and front views of the profiles.
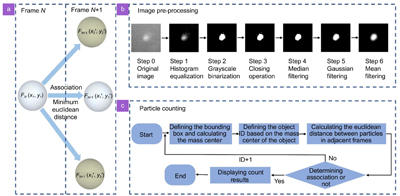
Fig. 2. (a ) Particle centroid tracking principle. (b ) Flow chart of image pre-processing. (c ) Flow chart of particle counting.
Fig. 3. (a ) Leukocytes in a channel captured by a miniature fluorescence microscope, with a magnified view of one of the cells and its profile curve. (b ) Working process of the particle counting algorithm.
Fig. 4. (a ) Scatter diagram and regression equation of total white blood cells from both methods analyzed by Passing-Bablok regression analysis, sample number = 40. Regression equation: y = 0.9926 x + 0.0678, correlation coefficient R = 0.979; 95% confidence interval for slope 0.7955 to 1.0304 and for intercept –0.4380 to 0.9189. (b ) The Bland-Altman analysis between the average and difference of the total white blood cells calculated by the two methods. The orange and yellow lines represent the upper and lower LOA, respectively, and the purple line represents the bias of the average count difference from 0. (c ) The white blood cell counting results obtained from a patient's whole blood using our Palm-size Optofluidic Hematology Analyzer. The orange line represents the average of 10-count results, and the yellow line represents the standard value obtained by the hemocytometer.
|
Table 1. Standard values, average values, and errors of white blood cell concentration for partial samples.

Set citation alerts for the article
Please enter your email address
© Copyright 2018-2021 | Chinese Laser Press. All Rights Reserved 沪ICP备15018463号-20