1Innovation Photonics and Imaging Center, School of Instrumentation Science and Engineering, Harbin Institute of Technology, Harbin 150080, China
2Department of Control Science and Engineering, Harbin Institute of Technology, Harbin 150081, China
3Department of Neurosurgery, The Second Affiliated Hospital of Harbin Medical University, Harbin 150086, China
4Institute of Optical Measurement and Intellectualization, Harbin Institute of Technology, Harbin 150080, China
5Beijing Institute of Collaborative Innovation, Beijing 100094, China
6State Key Laboratory of Membrane Biology, Beijing Key Laboratory of Cardiometabolic Molecular Medicine, Institute of Molecular Medicine, National Biomedical Imaging Center, School of Future Technology, Peking University, Beijing 100871, China
A critical function of flow cytometry is to count the concentration of blood cells, which helps in the diagnosis of certain diseases. However, the bulky nature of commercial flow cytometers makes such tests only available in hospitals or laboratories, hindering the spread of point-of-care testing (POCT), especially in underdeveloped areas. Here, we propose a smart Palm-size Optofluidic Hematology Analyzer based on a miniature fluorescence microscope and a microfluidic platform to lighten the device to improve its portability. This gadget has a dimension of 35 × 30 × 80 mm and a mass of 39 g, less than 5% of the weight of commercially available flow cytometers. Additionally, automatic leukocyte concentration detection has been realized through the integration of image processing and leukocyte counting algorithms. We compared the leukocyte concentration measurement between our approach and a hemocytometer using the Passing-Bablok analysis and achieved a correlation coefficient of 0.979. Through Bland-Altman analysis, we obtained the relationship between their differences and mean measurement values and established 95% limits of agreement, ranging from ?0.93×10³ to 0.94×10³ cells/μL. We anticipate that this device can be used widely for monitoring and treating diseases such as HIV and tumors beyond hospitals.
The deviations in blood cell concentration beyond reasonable ranges may indicate the presence of certain diseases within the body1. For example, infections2, 3, inflammatory4, 5, malignant blood diseases6, 7, and AIDS8 can cause abnormalities in the concentration of leukocytes. Therefore, the detection of blood cell concentration contributes to the diagnosis, treatment, and prognostic management of certain diseases. Hemocytometers are commonly used in laboratories and hospitals worldwide to calculate cell concentration because of their portability and low cost, but the counting process relies on professional manual handling9. The complex handwork and inefficiency have driven the development of hematology analyzers for automated blood cell concentration testing.
The commonly used blood analyzers include imaging hematology analyzers and flow cytometers. Imaging hematology analyzers perform cell counting by analyzing cell images on glass slides and are easily integrable. For instance, the MSLBX01 white blood cell analyzer by Hangzhou Livie Technology Co., Ltd. has dimensions of only 138 mm × 140 mm × 116 mm and weighs merely 750 g. Furthermore, smartphones, with their excellent imaging capabilities, often incorporate meticulously designed optics, light sources, and mechanical components to achieve portable imaging hematology analyzers10-13. However, the accuracy of these devices still needs further improvement as the counting results depend only on 100–200 cells in a single image12.
On the other hand, the flow cytometers allow high-throughput, accurate, and rapid sorting and counting of blood cells in fluids14-16. However, commercial flow cytometers are sophisticated and bulky with roughly 9–30 kg in mass. For example, the AccuriTM C6 PLUS flow cytometer from Becton, Dickinson, and Company weighs 13.6 kg and measures 279 × 373 × 419 mm. As a result, the corresponding equipment is often used in laboratories and hospitals, hindering the spread of point-of-care testing (POCT) and delaying patient’s treatments17.
Microfluidic chips offer a retrofit solution for miniaturization and functional expansion of flow cytometry18-21 with their compact size, high throughput, versatility, reagent and sample savings, and low sample contamination22-24. Nevertheless, with the use of conventional hardware such as light sources, objectives, and detectors, the complete body of microfluidic flow cytometry is commonly large and sensitive to shock and alignment problems, hampering the true portability25, 26. In parallel, with the advancements in microelectromechanical devices and nanofabrication techniques, the development of miniature fluorescence microscope has progressed rapidly over the past decade. However, they have mostly been employed in the fields of neuroscience and animal behavior research27-31. We intend to exploit its small size, low mass, high integration, and high imaging quality to apply it to hematology analyzer.
Here, we have constructed a miniature fluorescence microscope and integrated it with a compact microfluidic platform to realize a Palm-size Optofluidic Hematology Analyzer, measuring 35 × 30 × 80 mm and weighing 39 g. To obtain the concentration of white blood cells in the sample, the miniaturized fluorescence microscope records the stained white blood cells pumped into the field of view per unit time and subsequently, a particle counting algorithm is employed to quantify the cell numbers. We used this Palm-size Optofluidic Hematology Analyzer to measure leukocyte concentration in blood samples and compared the results with the counting values from a benchtop hemocytometer. The reliability of our device has been demonstrated by Passing-Bablok regression analysis and Bland-Altman analysis. Taken together, we have achieved the tiniest optofluidic hematology analyzer to our best knowledge, and it overcomes the bulky limitations of traditional flow cytometers and the sample throughput constraints of imaging hematology analyzers.
Materials and methods
Principle of the Palm-size Optofluidic Hematology Analyzer
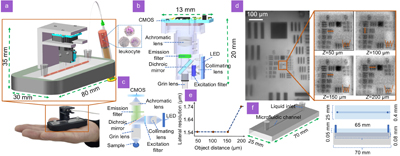
As shown in Fig. 1(a), we have designed a Palm-size Optofluidic Hematology Analyzer to automatically calculate cell concentrations in high-throughput and with high-portability. The major components of this gadget are a custom-constructed miniaturized fluorescence microscope and a compact microfluidic chip, and they are connected by a 3D-printed optical resin shelf. To obtain the concentration of blood cells, the stained blood samples are pumped into the microfluidic chip using an electric pump (LabQ Baoding Shencheng Precision Pump Co., Ltd.), and the blood cells that pass through the field-of-view of the miniature fluorescence microscope are counted with a particle counting algorithm. This Palm-size Optofluidic Hematology Analyzer is 35 × 30 × 80 mm in size and 39 g in mass, which is less than 5% of the commercial flow cytometers17. Fig. 1(b) and 1(c) highlight the model diagram and optical path of the miniature fluorescence microscope, respectively. The light from a 488 nm patch LED light source (LXML-PB01-0030 Digikey) is collimated by a hemispherical lens (47-269 Edmund Optics) and passes into the excitation filter (ET470/40x Chroma) for further purification. The excitation light is reflected by a dichroic mirror (T495lpxr Chroma) into a gradient refractive index (GRIN) lens (GT-IFRL-200-inf-50-NC Grintech, numerical aperture as 0.5, depth-of-focus as 100 μm) and focuses on the labeled sample. The emission light from the sample passes through the dichroic mirror and an emission filter (ET525/50m Chroma) into an achromatic lens (49-923 Edmund Optics) and focuses on a CMOS (Sierra Circuits, pixel number as 752 × 480, pixel size as 6 μm) sensor. The CMOS sensor works at a frame rate of 30 fps and an exposure time of 20 ms. The miniature fluorescence microscope is integrated via a 3D-printed (Form2 Formlabs) casing with a volume of 13 × 13 × 20 mm and a mass of 3 g. The custom-designed microfluidic chip is made of polydimethylsiloxane (PDMS) and commissioned by the Wandfo company. As shown in Fig. 1(d), the miniature fluorescence microscope has a field of view of 700 × 400 μm and can resolve group 8 line 3 of USAF target (R3L1S1B Thorlabs) at object distances of 50 μm, 100 μm, and 150 μm, respectively, and group 8 line 2 at object distance of 100 μm. Figure 1(e) illustrates the relationship between object distance and lateral resolution for the miniaturized fluorescence microscope, with a uniform lateral resolution of 1.54 μm for object distance between 50 μm and 150 μm, degrading to 1.74 μm for object distance up to 200 μm. The model diagram with the top and front view profiles of the microfluidic chip is shown in Fig. 1(f) and contains detailed design dimensions. The lateral resolution has been measured at different depths by imaging a USAF resolution target every 50 μm axially and determining the smallest resolved group by eye. The microfluidic flow channel is 400 μm wide for fully utilizing the field of view of the miniaturized fluorescence microscope and avoiding counting errors caused by cell congestion due to excessive narrowness. The microfluidic chip has an upper surface thickness of 50 μm and a channel depth of 80 μm, meaning that the sample flows through with an object distance of 50 μm to 130 μm, within the optimal imaging range of the miniaturized fluorescence microscope. The depth-of-field (DOF) between microfluidic devices and miniaturized fluorescence microscope should be adapted to ensure accurate particle recognition and measurement. If the sample is within the DOF, the cells will be clearly imaged and accurately counted. As cells move away from this range, the imaging contrast deteriorates due to defocusing, potentially leading to a loss in cell count. Leukocytes in the human body range in size from 7 μm to 20 μm32 and can be clearly distinguished by the device.
Figure 1.Principle and construction of the Palm-size Optofluidic Hematology Analyzer. (a) The photograph and model diagrams of the Palm-size Optofluidic Hematology Analyzer. (b) The model diagram of a miniature fluorescence microscope. (c) The optical path design of a miniature fluorescence microscope. (d) Results of the USAF target at various axial positions imaged by the miniature fluorescence microscope. Z stands for object distance. (e) The lateral resolution of miniature fluorescence microscope as a function of object distance. (f) The model diagram of the designed microfluidic chip with top and front views of the profiles.
Before performing the white blood cell concentration measurements using the device, pre-processing of the blood samples is required. To maintain the structural and physiological integrity of white blood cells, we took 100 μL of blood sample and placed it in a brown light-protected vial. First, 20 μL of acridine orange nucleic acid dye (AO Sigma) and 20 μL of red blood cell lysing solution (NP-40 Amresco) were added to the sample. Second, the mixture was diluted tenfold with 0.01 mol/L phosphate buffer solution and gently shaken. Finally, the sample was stained under ambient temperature and light-protected conditions for 15–20 minutes.
To avoid the cells clumping together and affecting identification, the sample was sufficient shaking and homogenization. The blood samples were then added to a syringe and driven by a high-precision pump into the channel of the microfluidic chip. The blood samples were diluted tenfold and flowed through the channel at a rate of 1 μL/min by adjusting the pump and recording the number of leucocytes passing through in 30 seconds. The flow rate and the number of leucocytes allow us to calculate the concentration of leucocytes in this sample, as shown in Eq. (1), where D represents leucocyte concentration (cells/μL), and N represents leucocyte number.
Particle counting algorithm
The particle counting algorithm is based on Python and implemented through NumPy, SciPy, and OpenCV. The core of the particle counting algorithm is a centroid tracking method, where particles in adjacent frames are correlated by their minimum Euclidean distance from each other. The principle of centroid tracking is shown in Fig. 2(a). In two adjoining frames, conceivably, the Euclidean distance between FN(x1, y1) and FN+1(x1', y1') is smaller than the other particles. Thus, these two particles are associated with each other and recorded as the same particle. The Euclidean distance is calculated in Eq. (2), where x1, y1, and x1', y1' are the Cartesian coordinates of the particles in the two neighboring frames, respectively.
Figure 2.(a) Particle centroid tracking principle. (b) Flow chart of image pre-processing. (c) Flow chart of particle counting.
The particle counting algorithm is divided into image pre-processing and particle counting. The image pre-processing is shown in Fig. 2(b). We first perform histogram equalization and grayscale binarization for each frame in the video stream to further differentiate between background and particle signal. This is followed by a closing operation to homogenize the fluorescence signal of the sample and a median filtering to denoise the image. Finally, the particle signal is further smoothed by Gaussian filtering and mean filtering. A sequence of image pre-processing steps is performed in preparation for the subsequent particle counting.
The particle counting is depicted in Fig. 2(c). We contour the particles in each frame, calculate the coordinates of their bounding box and centroid, and assign them an ID ordinal number. The same particle is associated with the minimum Euclidean distance of adjacent frames, and its ID number remains unchanged. When a new unassociated particle appears, a new ID number is assigned. Finally, the algorithm outputs the total ID number to obtain the total number of particles.
Statistical analyses
It is necessary to introduce another reliable method to test the same set of samples and perform consistency analysis to verify the validity and accuracy of the proposed method. Here, we utilized a commonly used benchtop hemocytometer for side-by-side comparisons of our device (more detailed experimental procedure in Supplementary Section 4). To assess the correlation and overall consistency between these two approaches, we applied the Passing-Bablok regression and the Bland-Altman analysis, respectively.
Compared to conventional linear fitting, the Passing-Bablok regression analysis is non-parametric, robust, and insensitive to errors and outliers and is suitable for evaluating the correlation of the two testing devices. Thus, the Passing-Bablok regression analysis33 was performed for both methods, and the regression equation is shown in Eq. (3), where the corresponding horizontal and vertical coordinates are the detection results of both methods for the same sample, respectively.
The a and b are the medians of the slope and intercept determined at any two points in the Cartesian coordinate system, respectively. If the 95% confidence interval of parameter a includes 1, and the 95% confidence interval of parameter b contains 0, there is no systematic or proportional difference between these two methods, and they can be considered interchangeable.
To evaluate the consistency of these two devices, and visually illustrate the differences between two measurement methods and their relationship with the mean measurement value, the Bland-Altman analysis34 was performed. The corresponding horizontal and vertical coordinates represent the mean and difference between the results of the two methods for the same samples, respectively. If a large majority of sample differences are within the 95% limits of agreement (LOA) of the mean difference, then the two methods have high consistency. The 95% LOA is shown in Eq. (4), where M is the mean of the sample’s differences, and S is the standard deviation of the sample's differences.
Results and discussion
Results
Leukocytes within the microfluidic channel captured by the miniature fluorescence microscope are shown in a distinct outline in Fig. 3(a), and the magnified view of one of the cells highlights its approximate size as 9 μm based on the intensity profile. Figure 3(b) shows a representative video frame after the particle counting algorithm, with the box framing the identified leukocytes and recording their total number in the top left corner. In Fig. 3(a), despite the presence of certain aberrations in miniature fluorescence microscope, their impact on the centroid coordinates of cells is negligible, thus not affecting the measurement accuracy. The counting process can be found in Supplementary Video 1.
Figure 3.(a) Leukocytes in a channel captured by a miniature fluorescence microscope, with a magnified view of one of the cells and its profile curve. (b) Working process of the particle counting algorithm.
For side-by-side comparisons between the proposed device and a conventional benchtop hemocytometer, we took blood samples from 40 groups of patients for white blood cell counting. With 10 repetitive measurements of each sample, we verified the reliability of the device by Passing-Bablok regression analysis, as shown in Fig. 4(a). The regression equation is y = 0.9926x + 0.0678, and the correlation coefficient is R = 0.9795. The 95% confidence intervals for the slope and intercept are 0.7955 to 1.0304 and –0.4380 to 0.9189, including 1 and 0, respectively. This suggests that our device has a high correlation with the conventional benchtop hemocytometer. Furthermore, we differenced the results of the two measurement methods in Fig. 4(a) and performed Bland-Altman analysis as illustrated in Fig. 4(b). The upper and lower limits of 95% LOA are 0.94 × 10³/μL and –0.93 × 10³/μL, respectively. Most of the measurement differences are within the 95% LOA of the average difference, and the bias of the average count difference from 0 is only 0.005×10³/μL, further demonstrating the consistency of the two methods. Finally, to evaluate white blood cell concentration, each assay procedure lasted 30 s and was repeated 10 times in a continuous blood flow, and the white blood cell concentration for each sample was plotted as a function of time, as depicted in Fig. 4(c). The average concentration was calculated for each sample by further averaging the results 10 times, and we compared this value with the standard value obtained from the hemocytometer. In this sample, the average white blood cell concentration measured by the proposed device is 6.04×10³/μL, and the standard value measured by the hemocytometer is 6.60×10³/μL, with an error of 8.48%.
Figure 4.(a) Scatter diagram and regression equation of total white blood cells from both methods analyzed by Passing-Bablok regression analysis, sample number = 40. Regression equation: y = 0.9926 x + 0.0678, correlation coefficient R = 0.979; 95% confidence interval for slope 0.7955 to 1.0304 and for intercept –0.4380 to 0.9189. (b) The Bland-Altman analysis between the average and difference of the total white blood cells calculated by the two methods. The orange and yellow lines represent the upper and lower LOA, respectively, and the purple line represents the bias of the average count difference from 0. (c) The white blood cell counting results obtained from a patient's whole blood using our Palm-size Optofluidic Hematology Analyzer. The orange line represents the average of 10-count results, and the yellow line represents the standard value obtained by the hemocytometer.
The standard values, average values, and errors of the white blood cell concentration for partial our data are listed in Table 1, and the error between the average and the standard value for each sample is less than 10%. This meets the maximum 10% specified by the United Kingdom National External Quality Assessment Service (UK NEQAS)35 and is within the 15% accepted by the Clinical Laboratory Improvements Amendments (CLIA)-8836, demonstrating equivalent accuracy against the benchtop devices but with superior portability. We have illustrated more details of the measurement range, repeatability, and contrast analysis of the system in Supplementary Section 1, Section 2, and Section 3, respectively.
Sample number
Average values (103/μL)
Standard values (103/μL)
Error (%)
1
3.02
3.30
8.48
2
3.53
3.71
4.85
3
6.03
6.38
5.49
4
7.73
8.05
3.98
5
8.88
9.35
5.03
Table 1. Standard values, average values, and errors of white blood cell concentration for partial samples.
There are several factors that affect the accuracy of blood cell count. Firstly, whole blood left in vitro for too long can lead to apoptosis of some blood cells and reduce the staining efficiency. In addition, cells adhering together or attaching to the channel wall can cause a loss of count. Therefore, the key to further improving the accuracy of the Palm-size Optofluidic Hematology Analyzer is to ensure that the blood sample is fresh and active, to perform a rigorous and standardized staining process, and to agitate it adequately. Furthermore, regarding the mass of the gadget, it could be further reduced, for example, by changing the optical resin shelf to aluminum or plastic.
Increasing the numerical aperture of the objective of the miniature fluorescence microscope and incorporating deep learning allow the classification and count of specific species of leukocytes. Moreover, microfluidic chips, in combination with other types of miniaturized microscopic imaging systems, such as miniaturized confocal microscopy or miniaturized phase contrast microscopy, also have a wide range of applications and potential for development.
To drive the sample through the microfluidic chip at a constant flow rate, a peristaltic pump is also required during operation. The data processing is conducted on a laptop computer. The peristaltic pump is essentially a variable-speed motor, and the palm-sized versions are also commercially available. Furthermore, considering the widespread availability of laptop computers, we argue that the proposed device is portable enough and fully meets the needs of POCT.
Conclusions
We built a miniature fluorescence microscope and combined it with microfluidics to construct a Palm-size Optofluidic Flow Hematology Analyzer 35 × 30 × 80 mm with a mass of 39 g and validated the gadget by Passing-Bablok regression analysis and Bland-Altman analysis. This device calculates leukocyte concentration with an error of less than 10%, meeting the requirements of UK NEQAS and CLIA-88 for white blood cell count accuracy.
Further improvements in our device are expected. To avoid issues such as out-of-focus caused by oscillations during movement, we will upgrade the casing to integrate the miniaturized fluorescence microscope system more securely with the microfluidic chip. Additionally, to further optimize the overall size and weight of the system, we intend to reduce the dimensions of the microfluidic chips. Regarding the analysis approaches, we will develop particle identification and classification algorithms, and integrate them with deep learning techniques. This will enable real-time classification of different types of white blood cells, providing more comprehensive information for disease diagnosis.
This allows POCT of patients’ blood cells away from the hospital or laboratory environment and enhances medical diagnosis in remote or deprived areas. In addition, performing blood cell counts by astronauts in space environments holds significant importance in the fields of radiation biology and microgravity biology. However, in such resource-limited and energy-intensive environments, the use of conventional equipment requiring chemical fuels and occupying substantial space significantly increases costs. In this context, the development of the Palm-size Optofluidic Hematology Analyzer offers a potential solution by addressing the issues of volume and weight.
Acknowledgements
This work was supported by the National Natural Science Foundation of China (grant no. 62305083 to W. Z., grant no. T2222009 to H. L., grant no. 32227802 to H. L.), China Postdoctoral Science Foundation (grant no. 2023T160163 to W. Z. grant no. 2022M720971 to W. Z.), the Heilongjiang Provincial Postdoctoral Science Foundation (grant no. LBH-Z22027 to W. Z.), the National Key Research and Development Program of China (grant no. 2022YFC3400600 to H. L.), and the Natural Science Foundation of Heilongjiang Province (grant no. YQ2021F013 to H. L.).
The authors declare no competing financial interests.