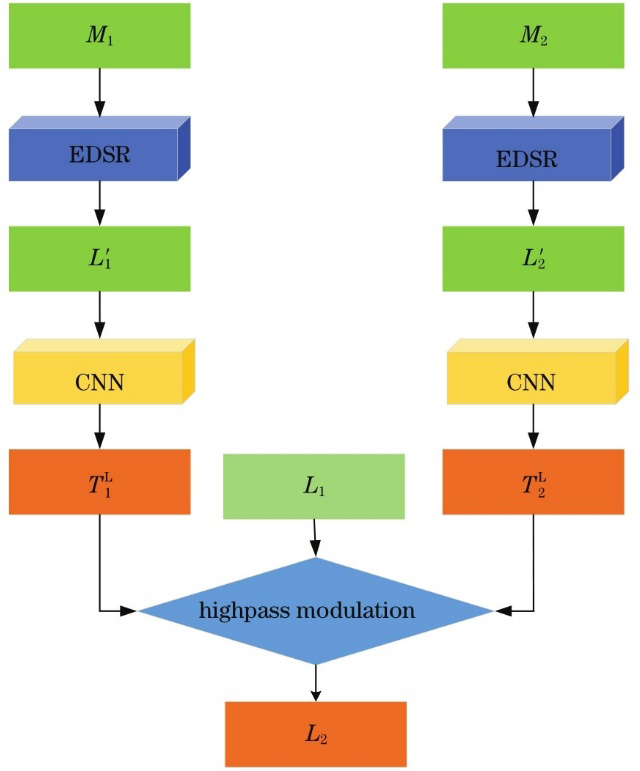
Fig. 1. Flow chart of proposed method
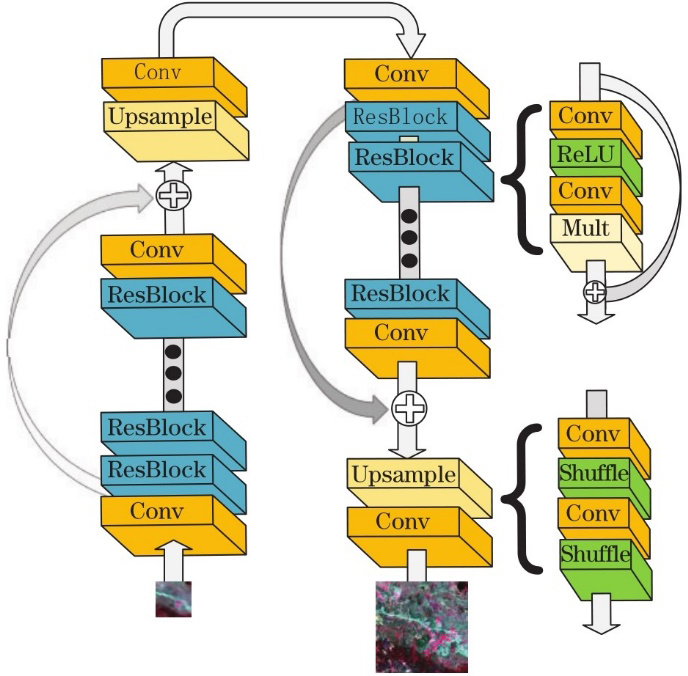
Fig. 2. Cascaded EDSR network for modeling spatial differences and sensor differences
Fig. 3. CNN network for residual correction
Fig. 4. Synthesis result of near infrared, red and green bands in the third image block of Landsat-7
Fig. 5. Synthesis result of near infrared, red and green bands in the third image block of Landsat-5
| Index | Band | STARFM | SPSTFM | FISTA | EBSCDL | FSDAF | STFDCNN | Proposed |
|---|
| RMSE | band1 | 0.0067 | 0.0068 | 0.0068 | 0.0069 | 0.0064 | 0.0099 | 0.0062 | | band2 | 0.0098 | 0.0112 | 0.0112 | 0.0104 | 0.0092 | 0.0118 | 0.0082 | | band3 | 0.0242 | 0.0270 | 0.0270 | 0.0231 | 0.0232 | 0.0304 | 0.0222 | | SSIM | band1 | 0.8669 | 0.7877 | 0.8653 | 0.8622 | 0.8811 | 0.8031 | 0.8028 | | band2 | 0.8090 | 0.7861 | 0.7864 | 0.7857 | 0.8277 | 0.7675 | 0.8511 | | band3 | 0.7488 | 0.7877 | 0.7880 | 0.7866 | 0.7718 | 0.7499 | 0.8028 | | SAM | | 0.0477 | 0.0567 | 0.0567 | 0.0510 | 0.0465 | 0.0574 | 0.0418 | | RASE | | 0.1670 | 0.1878 | 0.1877 | 0.1622 | 0.1593 | 0.2131 | 0.1509 | | ERGAS | | 0.1990 | 0.2182 | 0.2181 | 0.2076 | 0.1875 | 0.2523 | 0.1682 | | Q4 | | 0.7949 | 0.7661 | 0.7663 | 0.8128 | 0.8068 | 0.7761 | 0.8490 |
|
Table 1. Index evaluation of the first image block in Landsat-7 reconstruction result
| Index | Band | STARFM | SPSTFM | FISTA | EBSCDL | FSDAF | STFDCNN | Proposed |
|---|
| RMSE | band1 | 0.0063 | 0.0065 | 0.0065 | 0.0062 | 0.0059 | 0.0096 | 0.0056 | | band2 | 0.0092 | 0.0102 | 0.0102 | 0.0098 | 0.0086 | 0.0123 | 0.0080 | | band3 | 0.0304 | 0.0343 | 0.0343 | 0.0293 | 0.0289 | 0.0324 | 0.0275 | | SSIM | band1 | 0.7118 | 0.9123 | 0.9125 | 0.9098 | 0.9158 | 0.8586 | 0.9194 | | band2 | 0.8733 | 0.8558 | 0.8561 | 0.8558 | 0.8816 | 0.8172 | 0.8968 | | band3 | 0.7118 | 0.7482 | 0.7484 | 0.7458 | 0.7529 | 0.7394 | 0.7627 | | SAM | | 0.0492 | 0.0569 | 0.0569 | 0.0521 | 0.0485 | 0.0606 | 0.0430 | | RASE | | 0.2057 | 0.2309 | 0.1877 | 0.1991 | 0.1938 | 0.2293 | 0.1853 | | ERGAS | | 0.2115 | 0.2392 | 0.2390 | 0.2167 | 0.1974 | 0.2708 | 0.1930 | | Q4 | | 0.7659 | 0.6783 | 0.6785 | 0.7821 | 0.7842 | 0.7923 | 0.8247 |
|
Table 2. Index evaluation of the second image block in Landsat-7 reconstruction result
| Index | Band | STARFM | SPSTFM | FISTA | EBSCDL | FSDAF | STFDCNN | Proposed |
|---|
| RMSE | band1 | 0.0059 | 0.0066 | 0.0066 | 0.0063 | 0.0056 | 0.0100 | 0.0053 | | band2 | 0.0097 | 0.0115 | 0.0114 | 0.0105 | 0.0087 | 0.0125 | 0.0072 | | band3 | 0.0270 | 0.0301 | 0.0301 | 0.0260 | 0.0262 | 0.0421 | 0.0252 | | SSIM | band1 | 0.8636 | 0.8652 | 0.8655 | 0.8635 | 0.8835 | 0.7961 | 0.8883 | | band2 | 0.7918 | 0.7229 | 0.7231 | 0.7625 | 0.8153 | 0.7300 | 0.8501 | | band3 | 0.7736 | 0.7658 | 0.7658 | 0.7985 | 0.7854 | 0.7843 | 0.8108 | | SAM | | 0.0676 | 0.1204 | 0.1203 | 0.0754 | 0.0644 | 0.0842 | 0.0616 | | RASE | | 0.2133 | 0.2313 | 0.2312 | 0.2077 | 0.2034 | 0.3233 | 0.1934 | | ERGAS | | 0.2390 | 0.2819 | 0.2817 | 0.2529 | 0.2171 | 0.3220 | 0.1875 | | Q4 | | 0.9066 | 0.8738 | 0.8739 | 0.9106 | 0.9111 | 0.8162 | 0.9235 |
|
Table 3. Index evaluation of the third image block in Landsat-7 reconstruction result
| Index | Band | STARFM | SPSTFM | FISTA | EBSCDL | FSDAF | STFDCNN | Proposed |
|---|
| RMSE | band1 | 0.0058 | 0.0060 | 0.0060 | 0.0057 | 0.0053 | 0.0088 | 0.0049 | | band2 | 0.0088 | 0.0100 | 0.0100 | 0.0092 | 0.0081 | 0.0104 | 0.0064 | | band3 | 0.0287 | 0.0311 | 0.0311 | 0.0279 | 0.0281 | 0.0410 | 0.0270 | | SSIM | band1 | 0.8626 | 0.8849 | 0.8852 | 0.8827 | 0.8918 | 0.8315 | 0.8968 | | band2 | 0.8158 | 0.8004 | 0.8007 | 0.7988 | 0.8287 | 0.7953 | 0.8723 | | band3 | 0.7244 | 0.7656 | 0.7656 | 0.7605 | 0.7452 | 0.7187 | 0.7772 | | SAM | | 0.0498 | 0.0572 | 0.0572 | 0.0537 | 0.0499 | 0.0604 | 0.0395 | | RASE | | 0.1871 | 0.2028 | 0.2028 | 0.1821 | 0.1803 | 0.2631 | 0.1718 | | ERGAS | | 0.2020 | 0.2130 | 0.2129 | 0.2044 | 0.1847 | 0.2496 | 0.1547 | | Q4 | | 0.8007 | 0.7746 | 0.7747 | 0.8127 | 0.8049 | 0.7315 | 0.8476 |
|
Table 4. Index evaluation of the fourth image block in Landsat-7 reconstruction result
| Index | Band | STARFM | SPSTFM | FISTA | EBSCDL | FSDAF | STFDCNN | Proposed |
|---|
| RMSE | band1 | 0.0144 | 0.0203 | 0.0202 | 0.0160 | 0.0140 | 0.0238 | 0.0148 | | band2 | 0.0176 | 0.0243 | 0.0242 | 0.0196 | 0.0170 | 0.0321 | 0.0181 | | band3 | 0.0258 | 0.0348 | 0.0347 | 0.0288 | 0.0245 | 0.0402 | 0.0253 | | band4 | 0.0129 | 0.0156 | 0.0156 | 0.0140 | 0.0125 | 0.0236 | 0.0116 | | band5 | 0.0300 | 0.0368 | 0.0366 | 0.0289 | 0.0265 | 0.0460 | 0.0279 | | band6 | 0.0298 | 0.0389 | 0.0388 | 0.0309 | 0.0281 | 0.0499 | 0.0296 | | SSIM | band1 | 0.8636 | 0.8456 | 0.8463 | 0.8526 | 0.8634 | 0.8132 | 0.8726 | | band2 | 0.8566 | 0.8459 | 0.8488 | 0.8486 | 0.8546 | 0.7962 | 0.8696 | | band3 | 0.8131 | 0.8139 | 0.8179 | 0.8034 | 0.8177 | 0.7582 | 0.8317 | | band4 | 0.8666 | 0.8573 | 0.8593 | 0.8490 | 0.8632 | 0.8082 | 0.8758 | | band5 | 0.8006 | 0.8842 | 0.8866 | 0.8788 | 0.8648 | 0.8254 | 0.8863 | | band6 | 0.7901 | 0.8617 | 0.8640 | 0.8535 | 0.8375 | 0.7972 | 0.8651 | | SAM | | 0.0516 | 0.0516 | 0.0610 | 0.0613 | 0.0505 | 0.0862 | 0.0518 | | RASE | | 0.1386 | 0.1386 | 0.1975 | 0.1553 | 0.1337 | 0.2322 | 0.1410 | | ERGAS | | 0.1403 | 0.1403 | 0.2035 | 0.1569 | 0.1362 | 0.2423 | 0.1449 | | Q4 | | 0.8811 | 0.8811 | 0.8062 | 0.8639 | 0.8869 | 0.7761 | 0.8826 |
|
Table 5. Index evaluation of the first image block in Landsat-5 reconstruction result
| Index | Band | STARFM | SPSTFM | FISTA | EBSCDL | FSDAF | STFDCNN | Proposed |
|---|
| RMSE | band1 | 0.0146 | 0.0218 | 0.0217 | 0.0167 | 0.0146 | 0.0219 | 0.0150 | | band2 | 0.0181 | 0.0256 | 0.0255 | 0.0203 | 0.0180 | 0.0295 | 0.0187 | | band3 | 0.0254 | 0.0338 | 0.0336 | 0.0283 | 0.0252 | 0.0389 | 0.0258 | | band4 | 0.0130 | 0.0177 | 0.0176 | 0.0143 | 0.0128 | 0.0215 | 0.0116 | | band5 | 0.0296 | 0.0350 | 0.0349 | 0.0298 | 0.0284 | 0.0464 | 0.0294 | | band6 | 0.0353 | 0.0372 | 0.0370 | 0.0367 | 0.0360 | 0.0516 | 0.0364 | | SSIM | band1 | 0.8559 | 0.8231 | 0.8247 | 0.8330 | 0.8325 | 0.7909 | 0.8635 | | band2 | 0.8526 | 0.8336 | 0.8367 | 0.8375 | 0.8281 | 0.7836 | 0.8656 | | band3 | 0.8176 | 0.8064 | 0.8096 | 0.8031 | 0.8077 | 0.7633 | 0.8287 | | band4 | 0.8618 | 0.8506 | 0.8528 | 0.8430 | 0.8462 | 0.7996 | 0.8793 | | band5 | 0.7839 | 0.8626 | 0.8658 | 0.8533 | 0.8200 | 0.7884 | 0.8589 | | band6 | 0.7747 | 0.8434 | 0.8461 | 0.8239 | 0.7813 | 0.7635 | 0.8335 | | SAM | | 0.05380 | 0.0538 | 0.0619 | 0.0615 | 0.0519 | 0.0851 | 0.0526 | | RASE | | 0.1452 | 0.4152 | 0.2026 | 0.1642 | 0.1454 | 0.2307 | 0.1517 | | ERGAS | | 0.1490 | 0.1490 | 0.2145 | 0.1697 | 0.1497 | 0.2383 | 0.1573 | | Q4 | | 0.8819 | 0.8819 | 0.8156 | 0.8652 | 0.8805 | 0.7919 | 0.8828 |
|
Table 6. Index evaluation of the second image block of Landsat-5 reconstruction result
| Index | Band | STARFM | SPSTFM | FISTA | EBSCDL | FSDAF | STFDCNN | Proposed |
|---|
| RMSE | band1 | 0.0141 | 0.0234 | 0.0234 | 0.0154 | 0.0142 | 0.0186 | 0.0136 | | band2 | 0.0170 | 0.0285 | 0.0285 | 0.0189 | 0.0171 | 0.0271 | 0.0168 | | band3 | 0.0261 | 0.0355 | 0.0354 | 0.0281 | 0.0255 | 0.0387 | 0.0254 | | band4 | 0.0141 | 0.0206 | 0.0206 | 0.0147 | 0.0135 | 0.0207 | 0.0106 | | band5 | 0.0278 | 0.0385 | 0.0384 | 0.0276 | 0.0260 | 0.0396 | 0.0259 | | band6 | 0.0295 | 0.0377 | 0.0376 | 0.0302 | 0.0287 | 0.0458 | 0.0288 | | SSIM | band1 | 0.7282 | 0.7201 | 0.7228 | 0.7217 | 0.6934 | 0.7021 | 0.7559 | | band2 | 0.7549 | 0.7292 | 0.7325 | 0.7429 | 0.7150 | 0.7024 | 0.7777 | | band3 | 0.7960 | 0.7961 | 0.7998 | 0.7935 | 0.7817 | 0.7655 | 0.8152 | | band4 | 0.6960 | 0.6986 | 0.7020 | 0.6886 | 0.6920 | 0.6549 | 0.7363 | | band5 | 0.7200 | 0.8163 | 0.8201 | 0.8117 | 0.7764 | 0.7653 | 0.8223 | | band6 | 0.7219 | 0.8062 | 0.8089 | 0.7970 | 0.7600 | 0.7574 | 0.8121 | | SAM | | 0.0475 | 0.0475 | 0.0616 | 0.0542 | 0.0477 | 0.0735 | 0.0467 | | RASE | | 0.1374 | 0.1374 | 0.1992 | 0.1503 | 0.1369 | 0.2098 | 0.1374 | | ERGAS | | 0.1351 | 0.1351 | 0.2063 | 0.1488 | 0.1359 | 0.2040 | 0.1357 | | Q4 | | 0.8993 | 0.8993 | 0.8081 | 0.8890 | 0.8987 | 0.8250 | 0.9071 |
|
Table 7. Index evaluation of the third image block in Landsat-5 reconstruction result
| Index | Band | STARFM | SPSTFM | FISTA | EBSCDL | FSDAF | STFDCNN | Proposed |
|---|
| RMSE | band1 | 0.0129 | 0.0170 | 0.0169 | 0.0146 | 0.0127 | 0.0218 | 0.0135 | | band2 | 0.0160 | 0.0207 | 0.0206 | 0.0184 | 0.0160 | 0.0299 | 0.0172 | | band3 | 0.0232 | 0.0302 | 0.0301 | 0.0267 | 0.0224 | 0.0435 | 0.0248 | | band4 | 0.0104 | 0.0131 | 0.0130 | 0.0114 | 0.0100 | 0.0164 | 0.0098 | | band5 | 0.0288 | 0.0316 | 0.0315 | 0.0294 | 0.0276 | 0.0469 | 0.0294 | | band6 | 0.0361 | 0.0372 | 0.0371 | 0.0378 | 0.0375 | 0.0527 | 0.0373 | | SSIM | band1 | 0.7879 | 0.7807 | 0.7829 | 0.7745 | 0.7741 | 0.7370 | 0.8060 | | band2 | 0.8024 | 0.7879 | 0.7916 | 0.7844 | 0.7809 | 0.7288 | 0.8139 | | band3 | 0.8228 | 0.8127 | 0.8162 | 0.8015 | 0.8264 | 0.7553 | 0.8218 | | band4 | 0.7626 | 0.7597 | 0.7626 | 0.7455 | 0.7475 | 0.7185 | 0.7878 | | band5 | 0.7322 | 0.8197 | 0.8226 | 0.8073 | 0.7747 | 0.7444 | 0.8118 | | band6 | 0.7229 | 0.7878 | 0.7904 | 0.7697 | 0.6992 | 0.7187 | 0.7799 | | SAM | | 0.0461 | 0.0461 | 0.0626 | 0.0535 | 0.0464 | 0.0755 | 0.0472 | | RASE | | 0.1258 | 0.1258 | 0.1637 | 0.1451 | 0.1236 | 0.2383 | 0.1364 | | ERGAS | | 0.1301 | 0.1301 | 0.1700 | 0.1497 | 0.1291 | 0.2431 | 0.1413 | | Q4 | | 0.8943 | 0.8943 | 0.8561 | 0.8731 | 0.8976 | 0.7506 | 0.8839 |
|
Table 8. Index evaluation of the fourth image block in Landsat-5 reconstruction result