• Laser & Optoelectronics Progress
  • Vol. 59, Issue 8, 0815012 (2022)
Tao Liu1、2、*, Zhiqiang Yin1, Jingfa Lei1、2, and Fangbin Wang1、2
Author Affiliations
  • 1School of Mechanical and Electrical Engineering, Anhui Jianzhu University, Hefei , Anhui 230601, China
  • 2Anhui Provincial Key Laboratory of Intelligent Manufacturing of Construction Machinery, Hefei , Anhui 230601, China
  • show less
    DOI: 10.3788/LOP202259.0815012 Cite this Article Set citation alerts
    Tao Liu, Zhiqiang Yin, Jingfa Lei, Fangbin Wang. Multiresolution Feature Extraction of Surface Topography in Metal Fatigue Damage Process[J]. Laser & Optoelectronics Progress, 2022, 59(8): 0815012 Copy Citation Text show less
    Flow chart of surface topography feature extraction in fatigue damage process
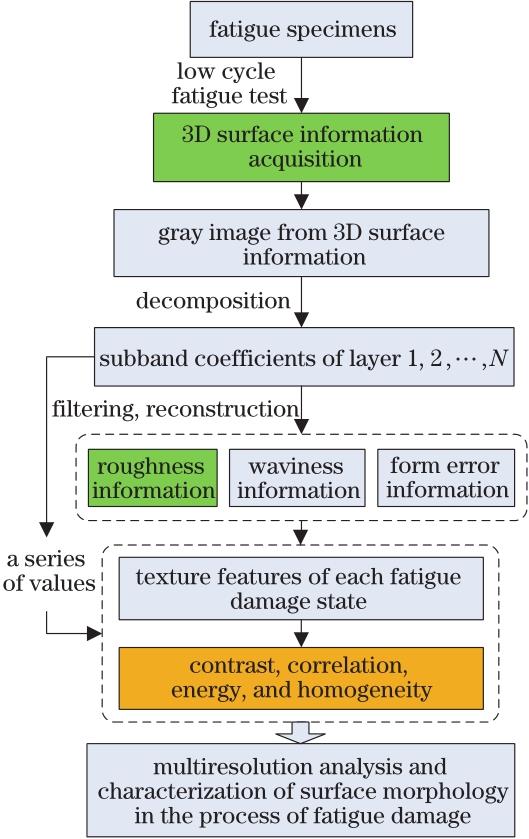
    Fig. 1. Flow chart of surface topography feature extraction in fatigue damage process
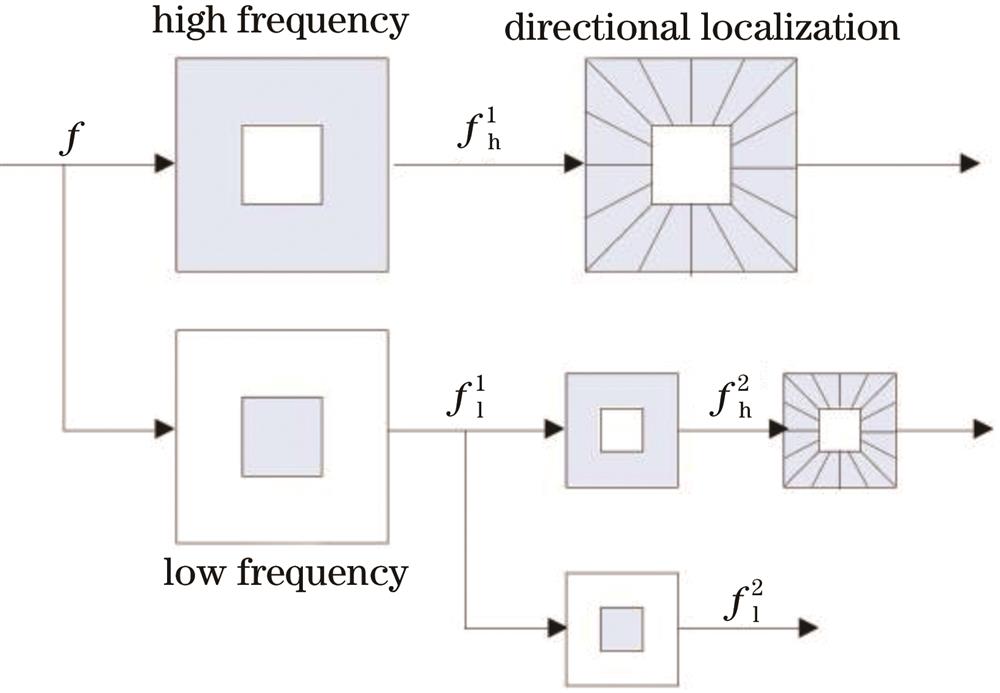
    ‍Schematic diagram of 2-layer decomposition of surface topography
    Fig. 2. ‍Schematic diagram of 2-layer decomposition of surface topography
    Specimen size
    Fig. 3. Specimen size
    Experimental system
    Fig. 4. Experimental system
    Diagram of specimen surface pretreatment area
    Fig. 5. Diagram of specimen surface pretreatment area
    3D topography of each fatigue damage stage[18]
    Fig. 6. 3D topography of each fatigue damage stage[18]
    Decomposition of gray images of each fatigue damage stage. (a) Fatigue cycle: 0; (b) fatigue cycles: 2000; (c) fatigue cycles: 4000; (d) fatigue cycles: 6000; (e) fatigue cycles 8000; (f) fatigue cycles 10000
    Fig. 7. Decomposition of gray images of each fatigue damage stage. (a) Fatigue cycle: 0; (b) fatigue cycles: 2000; (c) fatigue cycles: 4000; (d) fatigue cycles: 6000; (e) fatigue cycles 8000; (f) fatigue cycles 10000
    Contrast curves at the highest layer
    Fig. 8. Contrast curves at the highest layer
    Correlation curves at the highest layer
    Fig. 9. Correlation curves at the highest layer
    Characteristic parameter curves at the highest layer. (a) Energy; (b) homogeneity
    Fig. 10. Characteristic parameter curves at the highest layer. (a) Energy; (b) homogeneity
    Mean value curves of contrast at the highest layer
    Fig. 11. Mean value curves of contrast at the highest layer
    Mean value curves of correlation at the highest layer
    Fig. 12. Mean value curves of correlation at the highest layer
    Mean value curves of energy at the highest layer
    Fig. 13. Mean value curves of energy at the highest layer
    Mean value curves of homogeneity at the highest layer
    Fig. 14. Mean value curves of homogeneity at the highest layer
    Damage prediction results
    Fig. 15. Damage prediction results
    NContrastEnergyHomogeneity
    514.16230.01040.6025
    31.62690.00360.4785
    38.09800.00240.3913
    82.35050.00100.3200
    131.35380.00070.2928
    21.90160.00590.5100
    613.81410.00950.5964
    22.32930.00470.4974
    713.70140.00950.5967
    22.31330.00460.4957
    813.69160.00950.5959
    22.30010.00460.4959
    Table 1. Three types of characteristic data, including surface contrast, energy and homogeneity
    Tao Liu, Zhiqiang Yin, Jingfa Lei, Fangbin Wang. Multiresolution Feature Extraction of Surface Topography in Metal Fatigue Damage Process[J]. Laser & Optoelectronics Progress, 2022, 59(8): 0815012
    Download Citation