
Jihong Li, Longyu Lei, Mingke Du, Yunlong Zhang, Min Zhang, Jie Shi, Jun Gao. Structure and Properties of T2 Copper/304 Stainless Steel Laser Welded Joint[J]. Laser & Optoelectronics Progress, 2022, 59(13): 1316001
- Laser & Optoelectronics Progress
- Vol. 59, Issue 13, 1316001 (2022)
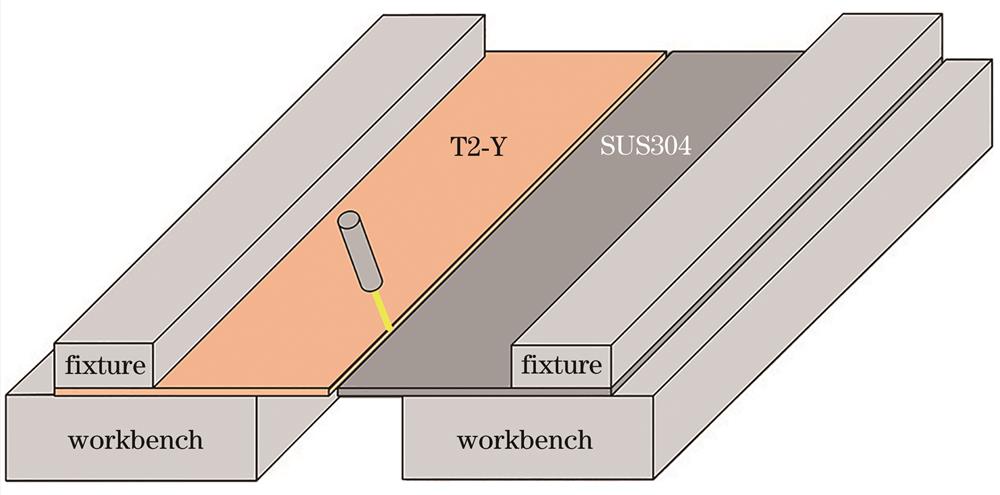
Fig. 1. Schematic diagram of laser welding
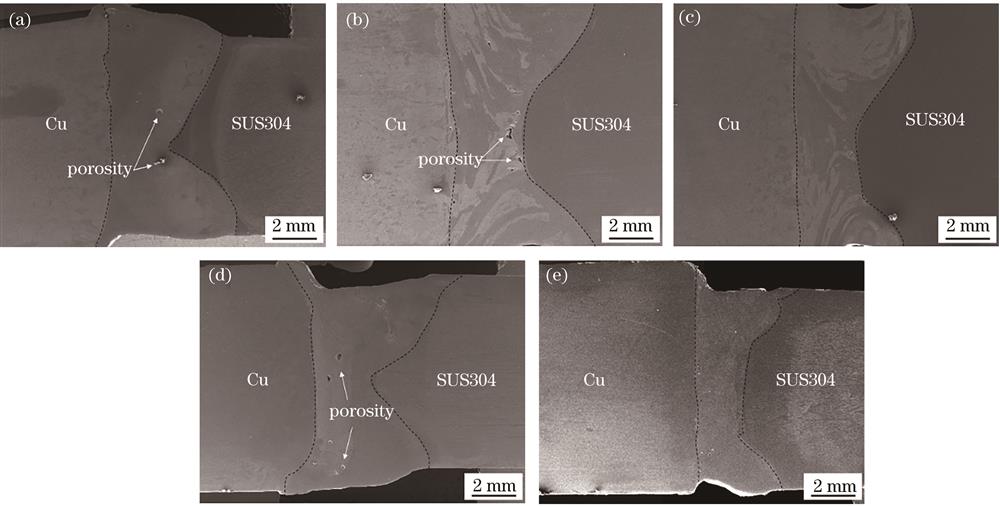
Fig. 2. Macro morphology of welded joints under different beam offsets. (a) 0 mm; (b) 0.2 mm;(c)0.4 mm;(d)-0.2 mm;(e)-0.4 mm
Fig. 3. Schematic diagrams of formation mechanism of weld morphology. (a) Metal evaporation force; (b) Marangoni convection
Fig. 4. Microstructure of the copper fusion zone under different beam offsets. (a) 0 mm; (b) 0.2 mm;(c)0.4 mm;(d)-0.2 mm;(e)-0.4 mm
Fig. 5. Microstructure of the weld center under different beam offsets. (a) 0 mm; (b) 0.2 mm; (c) 0.4 mm; (d) -0.2 mm; (e) -0.4 mm
Fig. 6. Tensile test results of welded joints. (a) Stress-strain curve; (b) stress-elongation histogram
Fig. 7. Fracture morphology of welded joints under different beam offsets. (a) 0 mm; (b) 0.2 mm; (c) 0.4 mm; (d) -0.2 mm; (e) -0.4 mm
Fig. 8. Results of microhardness test
Fig. 9. Distribution of microhardness
| |||||||||||||||||||||||||||||||
Table 1. Chemical composition of T2-Y and SUS304
|
Table 2. Mechanical properties of T2-Y and SUS304
|
Table 3. Laser welding parameters
| ||||||||||||||||||||||||||||||||||||||||||||||||||||||||||
Table 4. EDS test results of weld
| ||||||||||||||||||||||||||||
Table 5. EDS test results of stretch fracture

Set citation alerts for the article
Please enter your email address
© Copyright 2018-2021 | Chinese Laser Press. All Rights Reserved 沪ICP备15018463号-20