
Kai-lin ZHANG, Min ZHOU, Ying-ying SHI, Shu-qi LI, Li-fu MA, Xian-yi ZHANG, Yan WANG, Xiang-lei KONG. Development and Application of an Automated Program for Photodissociation Spectroscopy Study Based on a FT ICR Mass Spectrometer[J]. Spectroscopy and Spectral Analysis, 2021, 41(8): 2325
- Spectroscopy and Spectral Analysis
- Vol. 41, Issue 8, 2325 (2021)
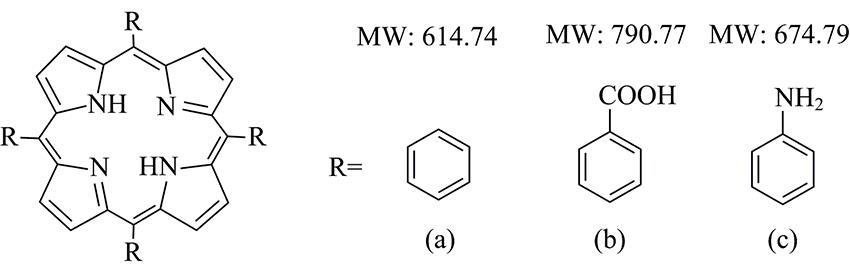
Fig. 1. Three species porphyrins compounds with different substituents
(a): TPP; (b): TCPP; (c): TAPP
(a): TPP; (b): TCPP; (c): TAPP
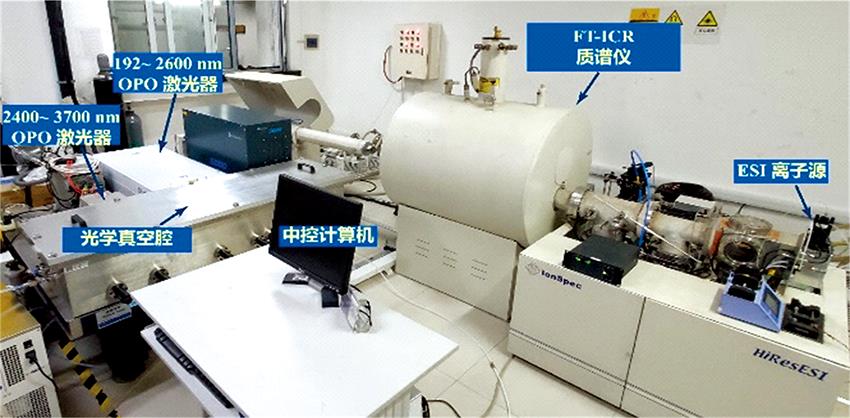
Fig. 2. A Picture of the experimental setup
Fig. 3. Software design flow charts
(a): AutoSpecMS; (b): AutoDataMS
(a): AutoSpecMS; (b): AutoDataMS
Fig. 4. The interface of the AutoDataMS program
Fig. 5. UV-Vis action spectra of three different ions(a): Protonated TPP; (b): Protonated TCPP; (c): Protonated TAPP
All Spectra are acquired in the range from 210~700 nm and a step of 2 nm. The data were collected by the AutoSpecMS program automatically
All Spectra are acquired in the range from 210~700 nm and a step of 2 nm. The data were collected by the AutoSpecMS program automatically
Fig. 6. Photodissociation mass spectra of selected ions obtained at different wavelengths
(a), (b) and (c) are the mass spectra of protonated TPP,TCPP and TAPP obtained with laser irradiation at 433 nm, while (d), (e) and (f) are ones obtained with laser at 550 nm, respectively
(a), (b) and (c) are the mass spectra of protonated TPP,TCPP and TAPP obtained with laser irradiation at 433 nm, while (d), (e) and (f) are ones obtained with laser at 550 nm, respectively
Fig. 7. Yield spectra of different fragment ions from different parent ions
(a): Fragment ion ofm/z 538 from the protonated TPP; (b): Fragment ions of m/z 670 (in red) and m/z 745 (in black) from the protonated TCPP; (c): Fragment ions of m/z 583 (in red) and m/z 658 (in black) from the protonated TAPP
(a): Fragment ion of
Fig. 8. 2D photodissociation mass spectra of protonated
(a): TPP; (b): TCPP; (c): TAPP
(a): TPP; (b): TCPP; (c): TAPP
Fig. 9. Correlation coefficient diagram of TPP photodissociation fragments

Set citation alerts for the article
Please enter your email address
© Copyright 2018-2021 | Chinese Laser Press. All Rights Reserved 沪ICP备15018463号-20