• Acta Optica Sinica
  • Vol. 40, Issue 8, 0828001 (2020)
Jianwen Weng1、2, Yinlin Yuan1、*, Xiaobing Zheng1, Qing Kang1, Bihai Tu1、2, Maopeng Xia1, and Jin Hong1
Author Affiliations
  • 1Key Laboratory of Optical Calibration and Characterization, Anhui Institute of Optics and Fine Mechanics, Chinese Academy of Sciences, Hefei, Anhui 230031, China
  • 2University of Science and Technology of China, Hefei, Anhui 230026, China
  • show less
    DOI: 10.3788/AOS202040.0828001 Cite this Article Set citation alerts
    Jianwen Weng, Yinlin Yuan, Xiaobing Zheng, Qing Kang, Bihai Tu, Maopeng Xia, Jin Hong. Method for Measuring Response Non-Uniformity of Polarization Channels in Directional Polarization Camera[J]. Acta Optica Sinica, 2020, 40(8): 0828001 Copy Citation Text show less
    DPC optical system. (a) Structure of DPC optical system; (b) imaging path of DPC optical system
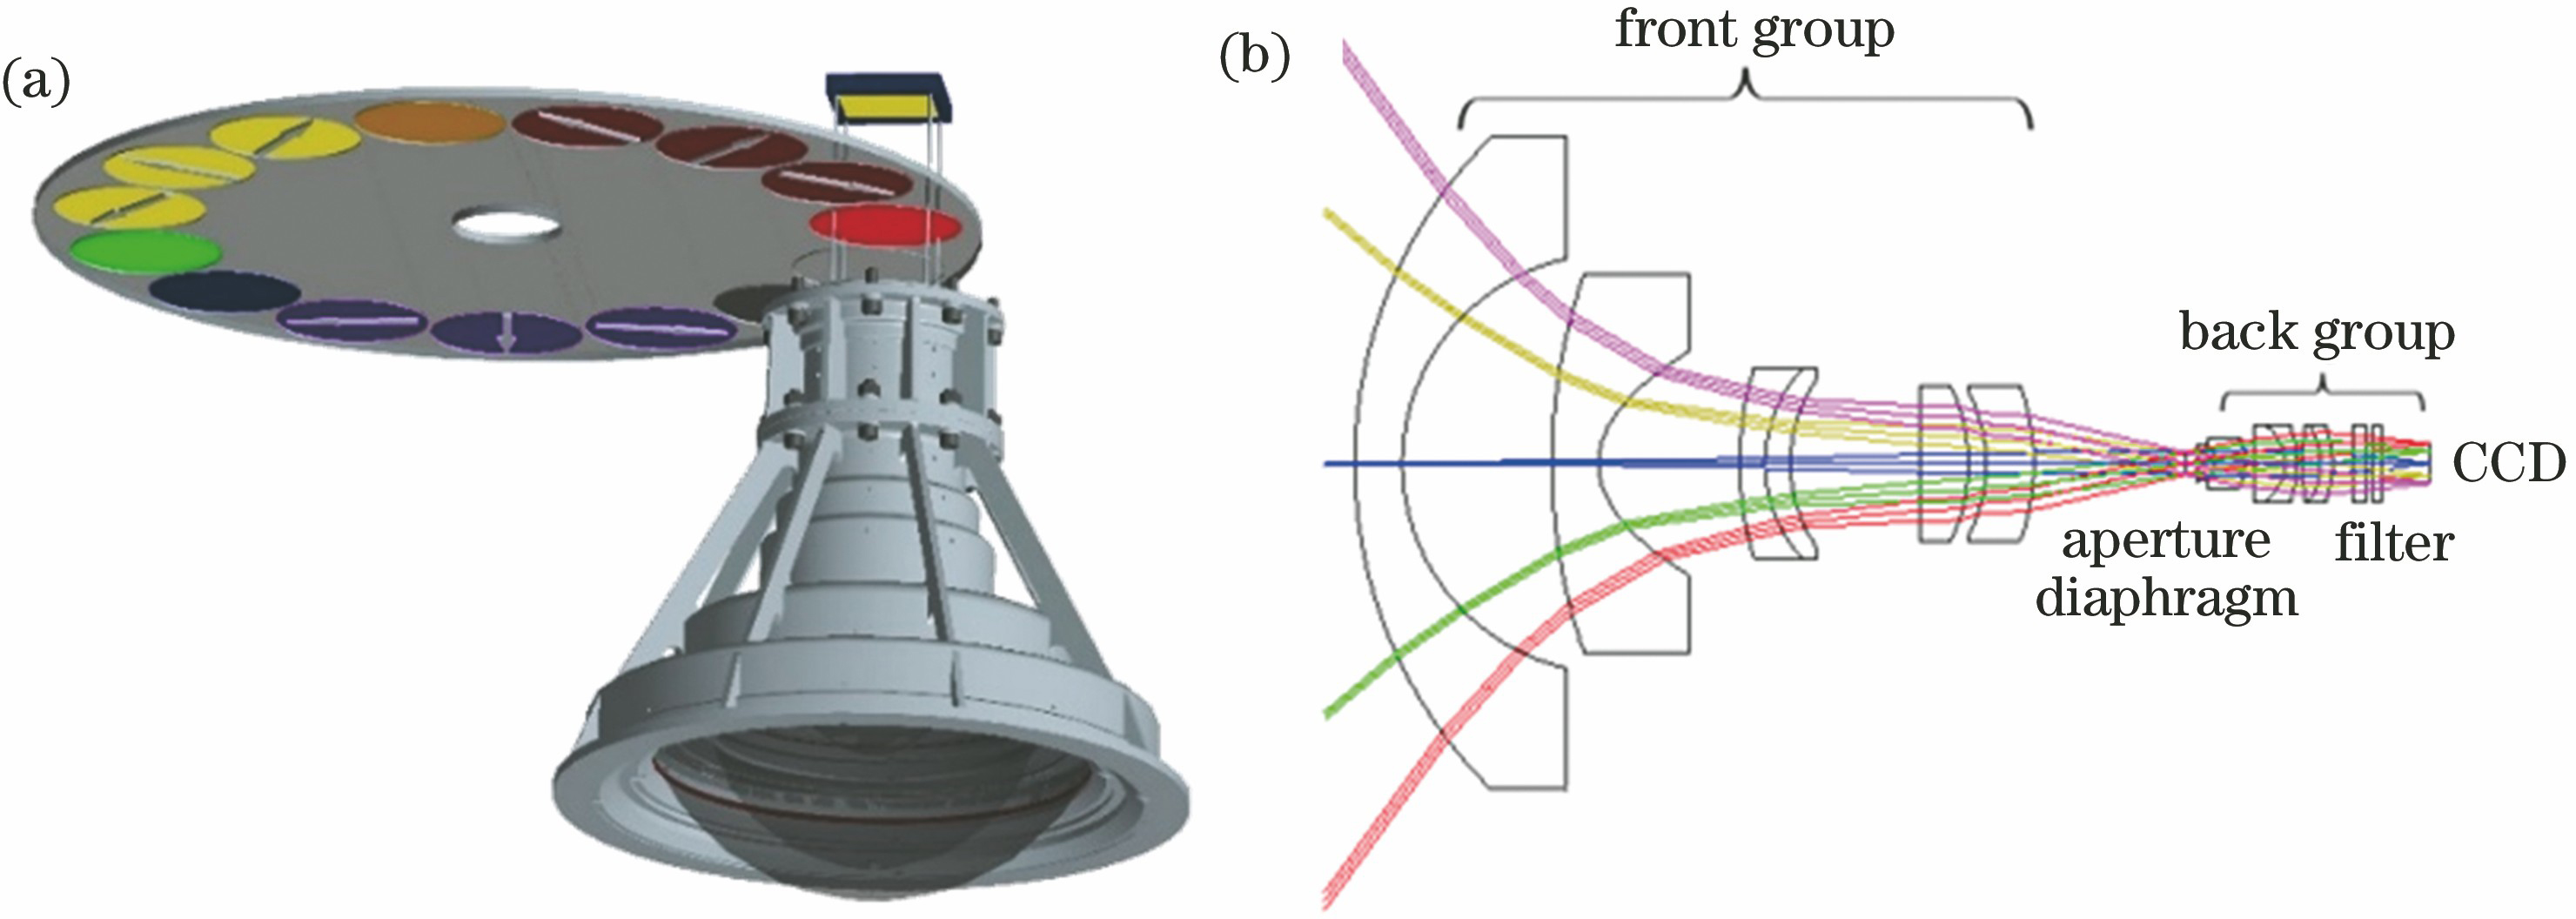
    Fig. 1. DPC optical system. (a) Structure of DPC optical system; (b) imaging path of DPC optical system
    Installation diagram of optical filter and analyser module
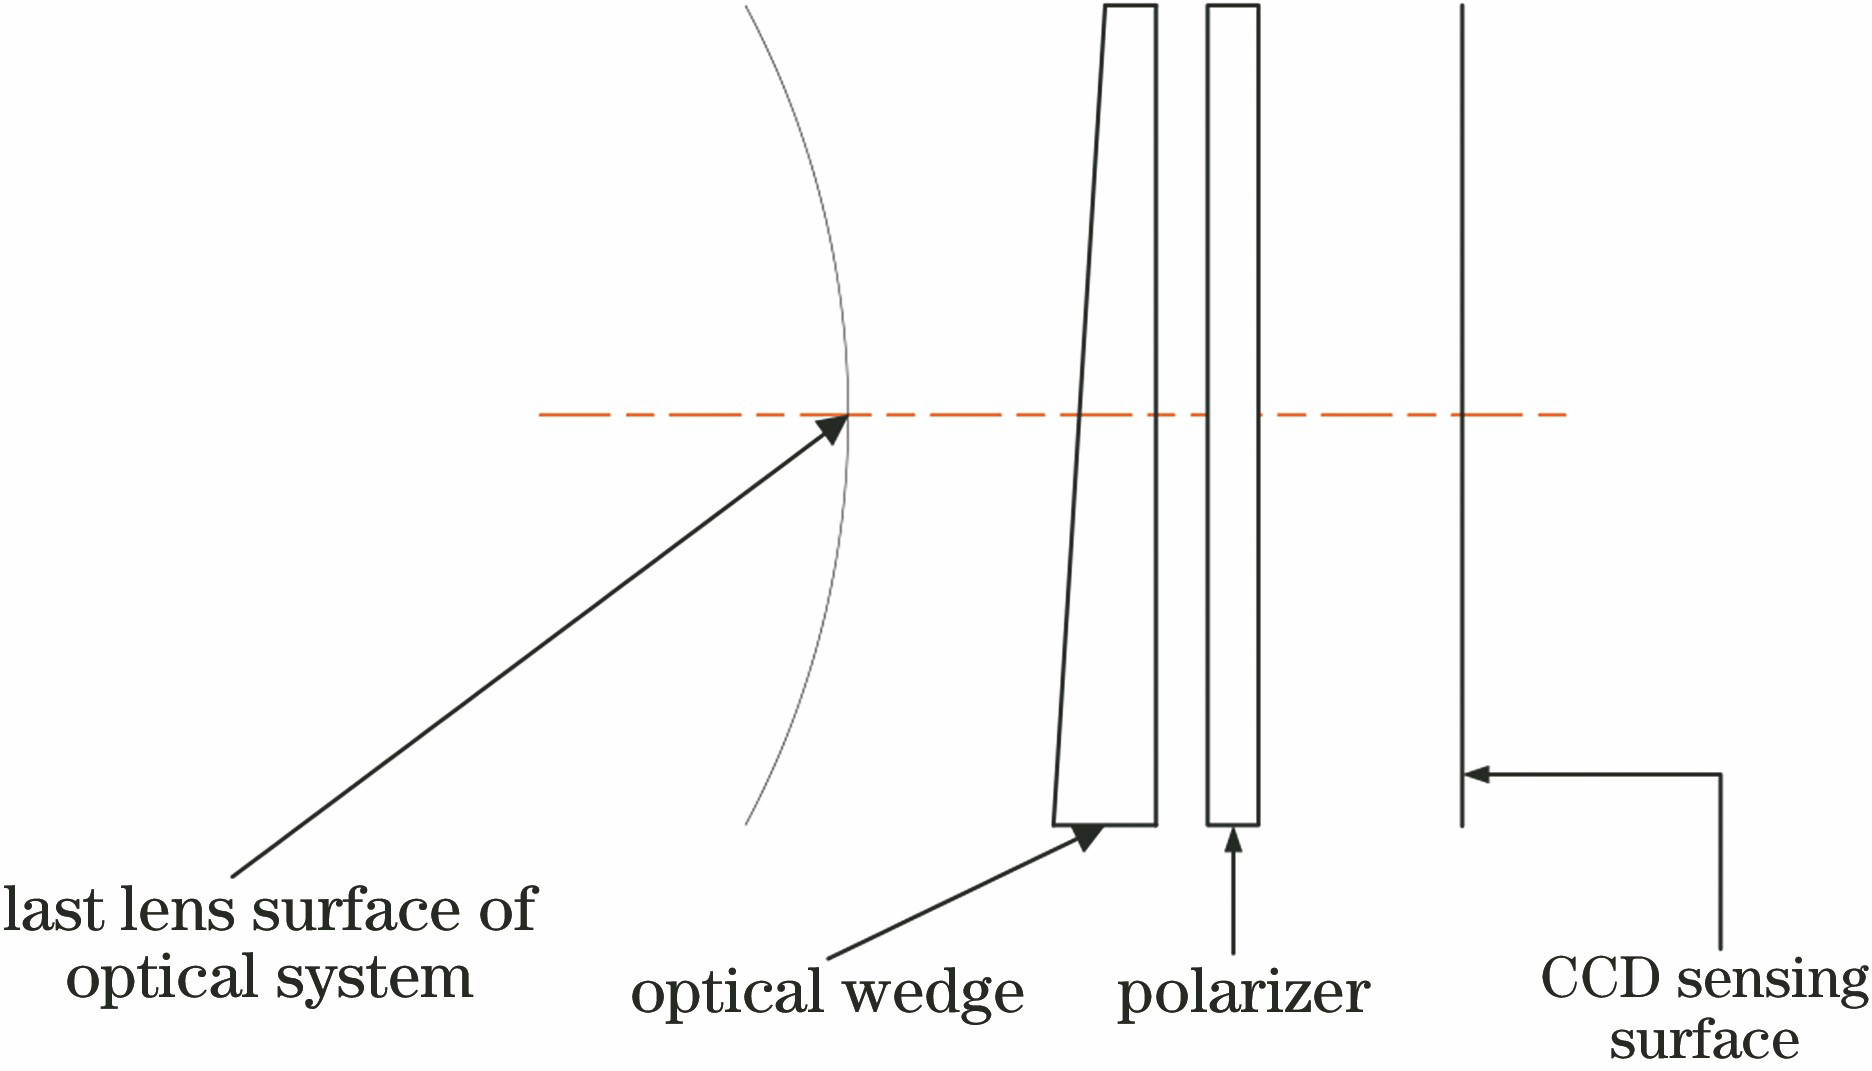
    Fig. 2. Installation diagram of optical filter and analyser module
    Integral sphere reference light imaging in single field-of-view
    Fig. 3. Integral sphere reference light imaging in single field-of-view
    Sectional field-of-view measurement of polarization channel response non-uniformity. (a) Schematic of lighting for sectional field-of-view measurement; (b) schematic of sectional field-of-view measurement; (c) experiment diagram of sectional field-of-view measurement
    Fig. 4. Sectional field-of-view measurement of polarization channel response non-uniformity. (a) Schematic of lighting for sectional field-of-view measurement; (b) schematic of sectional field-of-view measurement; (c) experiment diagram of sectional field-of-view measurement
    Response non-uniformity among three channels in same waveband. (a) Channel 13/channel 14; (b) channel 15/channel 14
    Fig. 5. Response non-uniformity among three channels in same waveband. (a) Channel 13/channel 14; (b) channel 15/channel 14
    Bad pixel detection window
    Fig. 6. Bad pixel detection window
    Detection result of bad pixels at (187,96) of mosaic image in channel 3 sectional field-of-view imaging
    Fig. 7. Detection result of bad pixels at (187,96) of mosaic image in channel 3 sectional field-of-view imaging
    Calibration process of polarization channel response non-uniformity
    Fig. 8. Calibration process of polarization channel response non-uniformity
    Detection of bad pixels in laboratory before launch. (a) Original image; (b) 11×11 area composite graph for detecting bad pixels
    Fig. 9. Detection of bad pixels in laboratory before launch. (a) Original image; (b) 11×11 area composite graph for detecting bad pixels
    Detection of bad pixels of on-orbit imaging data after launch. (a) The second circle on-orbit imaging data; (b) 11×11 area composite graph for detecting bad pixels
    Fig. 10. Detection of bad pixels of on-orbit imaging data after launch. (a) The second circle on-orbit imaging data; (b) 11×11 area composite graph for detecting bad pixels
    Detection of bad pixels of imaging data after one year on-orbit operation. (a) The 5638th circle on-orbit imaging data; (b) 11×11 area composite graph for detecting bad pixels
    Fig. 11. Detection of bad pixels of imaging data after one year on-orbit operation. (a) The 5638th circle on-orbit imaging data; (b) 11×11 area composite graph for detecting bad pixels
    Calculation results of low and high frequency relative transmittances. (a) Low frequency relative transmittance; (b) high frequency relative transmittance
    Fig. 12. Calculation results of low and high frequency relative transmittances. (a) Low frequency relative transmittance; (b) high frequency relative transmittance
    Test results of integral sphere uniformity and angle characteristic. (a) Surface uniformity detection; (b) angle characteristic test curve
    Fig. 13. Test results of integral sphere uniformity and angle characteristic. (a) Surface uniformity detection; (b) angle characteristic test curve
    Result of non-stability test
    Fig. 14. Result of non-stability test
    August 15, 2016May 10, 2018May 30, 2019
    Line numberColumn numberRatioLine numberColumn numberRatioLine numberColumn numberRatio
    21142.3021141.4221141.39
    21151.3121150.7221150.68
    22140.8822140.5622140.51
    22150.46582740.60582740.64
    582740.71592740.54592740.57
    592740.61129180.32129180.31
    95500.36149530.70149530.68
    129180.64186951.56186951.55
    185950.32186940.57186940.49
    186951.832801180.582801180.54
    186940.462801170.472801170.48
    187950.332811170.772811170.78
    2801180.585251180.365022320.60
    2801170.485251180.36
    2811170.76
    5251180.49
    Table 1. Detection results of bad pixels
    Angle /(°)865 nm670 nm490 nm
    00.9920.9981.001
    601.0001.0001.000
    1200.9971.0371.015
    Table 2. Relative transmittance results
    ParameterSurface uniformityStandard deviationAverage voltage /VMaximum voltage /VMinimum voltage /V
    Value0.27%0.00853.13453.14903.1180
    Table 3. Processing results of surface uniformity test data
    Angle /(°)-6-4-20246
    Vertical angular characteristic00.0030.001000.0020.006
    Horizontal angular characteristic0.0020000.00100.004
    Table 4. Processing results of angular characteristic data
    Channel1345678
    Wavelength /nm565670 P1670 P2670 P3763765865 P1
    Non-stability0.070.050.060.060.130.140.12
    Grayscale response mean3806.968104.418115.318426.375914.234438.315472.28
    Channel9101112131415
    Wavelength /nm865 P2865 P3910443490 P1490 P2490 P3
    Non-stability0.120.120.110.080.060.060.07
    Grayscale response mean5516.725506.047892.562336.094956.344949.275029.30
    Table 5. Results of non-stability test
    Jianwen Weng, Yinlin Yuan, Xiaobing Zheng, Qing Kang, Bihai Tu, Maopeng Xia, Jin Hong. Method for Measuring Response Non-Uniformity of Polarization Channels in Directional Polarization Camera[J]. Acta Optica Sinica, 2020, 40(8): 0828001
    Download Citation