
Xiu-lian ZHANG, Fang ZHANG, Nuan ZHOU, Jing-jie ZHANG, Wen-fang LIU, Shuai ZHANG, Xiao-jie YANG. Near-Infrared Spectral Feature Selection of Water-Bearing Rocks Based on Mutual Information[J]. Spectroscopy and Spectral Analysis, 2021, 41(7): 2028
- Spectroscopy and Spectral Analysis
- Vol. 41, Issue 7, 2028 (2021)
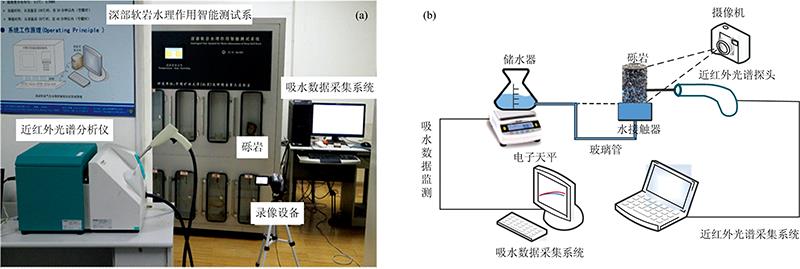
Fig. 1. (a) Water sorption test system and near-infrared testing device; (b) schematic diagram of the experimental setup
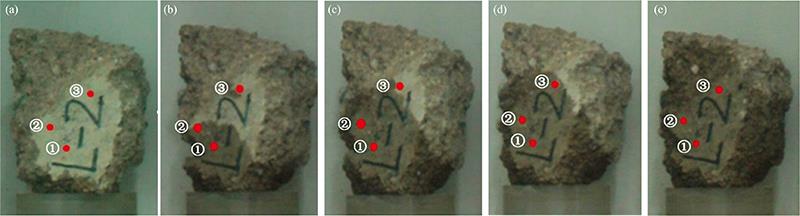
Fig. 2. Visible light map of the conglomerate water absorption process
(a): 409 s; (b): 558 s; (c): 704 s; (d): 775 s; (e): 1 224 s
(a): 409 s; (b): 558 s; (c): 704 s; (d): 775 s; (e): 1 224 s
Fig. 3. Near-infrared spectrum of conglomerate point 1
(a): Original spectrum; (b): NPS+B-corr pre-processed spectrum
(a): Original spectrum; (b): NPS+B-corr pre-processed spectrum
Fig. 4. Schematic diagram of initial characteristic variables
Fig. 5. Peak height of water content and water content level partition
(a): Point 1; (b): Point 2; (c): Point 3
(a): Point 1; (b): Point 2; (c): Point 3
Fig. 6. Water content level C-feature f scatter plot
(a): Height-C; (b): LHW-C; (c): RHW-C
(a): Height-C; (b): LHW-C; (c): RHW-C
Fig. 7. The accuracies of the decision tree classifier for peak R 1 (a) and peak R 2 (b)
|
Table 1. Basic information of the conglomerate samples
|
Table 2. Mineral composition of the conglomerate samples
|
Table 3. Experimental parameters of near infrared spectrometer acquisition system
|
Table 4. Initial characteristic variables of near-infrared spectra at 1 450 nm (only part of data listed)
|
Table 5. Normalized initial characteristic variables of near-infrared spectra at 1 450 nm (only part of data listed)
|
Table 6. Mutual information values of characteristic variables and water content levels
|
Table 7. MIC values for correlation between the characteristic variables and water content levels

Set citation alerts for the article
Please enter your email address
© Copyright 2018-2021 | Chinese Laser Press. All Rights Reserved 沪ICP备15018463号-20