
Petrisor Gabriel Bleotu, Radu Udrea, Alice Dumitru, Olivier Uteza, Maria-Diana Mihai, Dan Gh Matei, Daniel Ursescu, Stefan Irimiciuc, Valentin Craciun. Exploring fs-laser irradiation damage subthreshold behavior of dielectric mirrors via electrical measurements[J]. High Power Laser Science and Engineering, 2024, 12(2): 02000e15
- High Power Laser Science and Engineering
- Vol. 12, Issue 2, 02000e15 (2024)
Abstract
1. Introduction
The progress of modern high-power laser systems towards the generation of extreme fields, currently demonstrating up to 10 PW pulses[1,2], has been impeded by one main challenge: the modest resistance to laser-induced optical damage of their constituent components. The threshold resistance is further stretched to the limits within post-compression techniques via thin film compression[3], which have been successfully used to increase the peak power for different input laser pulse duration[4,5] and J-level energy[6].
During multipulse fs-laser irradiation, there is a multitude of phenomena occurring in the optical coatings that are not completely understood. Thus, a generic term ‘incubation effect’ is often employed to account for all these effects[7,8] on the laser-induced damage threshold (LIDT). The appearance of the incubation effect lowers the LIDT value with the increase in the number of laser pulses. Besides the high cost of the destroyed optical component, catastrophic damage could create a plasma mirror on the surface of the affected optical component that might deflect the extremely powerful laser pulse in an unpredictable direction and cause additional extensive damage to other expensive equipment located in the vicinity. As shown in several studies[9–11], the bandgap of the material is strongly connected to the measured LIDT value. However, the diffusion of the materials in multilayer coatings, together with the presence of the laser field, can lead to the presence of impurities in the optical coating material that introduces transient[12,13] or permanent midgap states that reduce the LIDT value of the components. For example, the presence of oxygen atom defects in
The determination of the LIDT by irradiating the optical components with laser pulses and measuring the scattered light or the subsequent permanent modification of the surface morphology represents a standardized method[16] to characterize the quality of these optical components. Alternative empiric methods to define the LIDT include piezoelectric transducers[17], white light generation[18], free-electron plasma luminosity[19], etc. However, the empirically determined LIDT of the optical components cannot be always completely reproduced on similar samples. This is the effect of minute modifications in the production processes at a microscopic scale that are not observed in the manufacturing process. Among these, residual contaminations of the material during preparation, polishing and substrate cleaning are other factors contributing to changes in the intrinsic properties of the material.
Sign up for High Power Laser Science and Engineering TOC. Get the latest issue of High Power Laser Science and Engineering delivered right to you!Sign up now
Over the years, numerous techniques have been developed for monitoring laser-ablated material. They often consider the fundamental mechanisms involved in short and ultrashort laser–matter interaction. The scenarios for material removal from the target follow a complex interconnectivity of electrostatic and thermal mechanisms, which are temporally and spatially separated: the first stages of laser ablation are of an electrostatic nature, while the second stages are of a thermal nature. In our previous work[20], we have shown that the Langmuir probe (LP) is a suitable technique for estimating the nanosecond ablation threshold limit as it detects contributions from each stage[21]. Other reports focus on LP measurements of ablation threshold in the ns regime[22], while reports on the detection of the fs-incubation stage emphasize the necessity of having a minimum of 10,000 pulses to estimate the threshold[23]. In general, the data available in the literature regarding LP measurements concerns the dynamics of the charged particle above the ablation threshold at a large distance (over 2–3 cm) from the target[24]. However, as the LP technique is based on charge collection, it could be promising for subthreshold measurements. When relating to the LIDT, there is still key interest in the behavior of optical components below the LIDT where understanding electron emission and target compensation current in a wide range of irradiation conditions becomes imperative.
In this paper, we report on the determination of the LIDT on a series of
2. Materials and methods
2.1. Thin film preparation
The pulse laser deposition (PLD) method was used to deposit a series of 70 nm thick
2.2. Methods
The experimental setup, as illustrated in Figure 1, comprises two main sub-assemblies[28]. The first sub-assembly involves the measurement of the LP and TC in a vacuum, while the second sub-assembly is dedicated to in situ imaging in air.
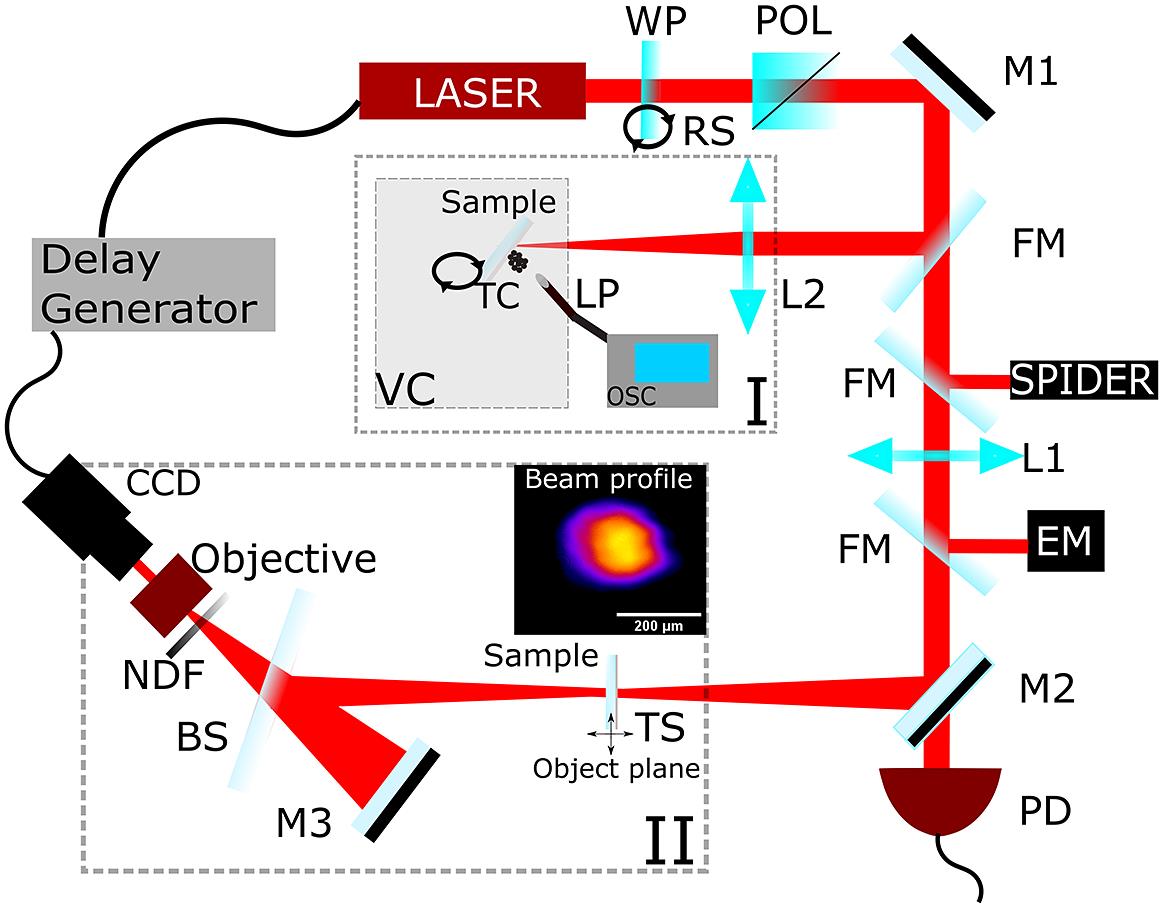
Figure 1.Experimental setup. BS, beam splitter; EM, energy meter; FM, flip mirror; LASER, Ti:sapphire; L1 and L2, focusing lenses; LP, Langmuir probe; M1, high-reflection mirrors; M2, 99 -reflection mirror; M3, spherical mirror; NDF, neutral density filter; OSC, oscilloscope; POL, polarizer; PD, photodiode; TC, target current; TS, translation stage; RS, rotation stage; VC, vacuum chamber; WP, half-waveplate. The inset illustrates the input beam profile used for
  calculation.
An AVESTA Ti:sapphire laser system was used to provide compressed laser pulses (70 fs, 800 nm, 10 Hz, 1.6 mJ, 8 mm diameter) to the experimental setup. The pulse energy was reduced by using the combination of a half-waveplate (WP) and a thin polarizer (POL). The measurements were performed using p-polarized laser pulses. The WP was mounted on a motorized rotation stage allowing the polarization change by up to 90° for 45° of WP rotation. The transmitted energy (3% root mean square (RMS)) was measured using a Gentec energy meter (EM) after each lens where the beam covered 70% of the detection area, while the photodiode (PD) can record a signal calibrated with the measured energy during shots. The laser pulses were focused by plano-convex lenses (L1, 40 cm focal length, and L2, 75 cm focal length) on the samples. The movement of the sample was assured by a 3D translation stage to cover multiple irradiation sites. The pulse duration (70
The first assembly consists of a large Rayleigh range lens (L2) and a vacuum chamber (VC) where the sample, the rotation stage and the LP and TC measurement system were positioned. LP-TC experiments were performed inside a VC at a residual pressure of 10
The second assembly, an imaging system (IS) (BS-M3-BS-Objective-CCD), was designed to efficiently monitor, in real-time, the intensity pattern in the interaction area (object plane) of a laser beam with the sample. The IS had a resolution of 13 μm (1 pixel = 1.7 μm), calibrated with a 1951 US Air Force (USAF) target. A variable neutral density filter (NDF) was implemented to adjust the amplitude of the image recorded by the charge-coupled device (CCD), in case of saturation.
The effective beam area on the target surface (
Automation of the entire experiment requires a specific synchronization time control for all the devices. A delay generator triggered by a signal from the laser control unit is used to generate on-demand pulses by gating the opening of the Pockels cell and also to send synchronization signals to the camera, PD, NDF, stages and the oscilloscope used for data acquisition.
3. Results and discussion
The fundamental landscape of fs-laser–matter interaction is dominated by non-thermal and electrostatic interactions[31], mostly occurring on a sub-ps time scale. Therefore, key properties of the dielectric mirrors, such as defects and oxygen vacancies, can affect the local electrical property of the film and thus the local value of the LIDT. If we follow the fs-ablation scenario, which was reported by Bulgakova et al.[32], the electrons are the first excited particles and will be ejected from the target, leaving behind a positively charged surface. The charge separation defines an electrical field that accelerates the target’s ions and leads to the subsequent breakdown of the materials. Since electron ejection is a gradual process, this means that even below the usual defined LIDT limit, charges can be collected by implementing electric diagnostics tools. Any charge imbalance in the sample as a result of the laser irradiation can be defined by two responses: a transient electronic current that will be collected by the LP and a compensation current in the dielectric film (target) with an opposite sign to maintain charge neutrality.
In Figure 2 we have plotted representative charge current traces collected by the probe (LP) and from the sample (TC) above and below the threshold according to optical measurements. The higher sensitivity of the TC is noticeable, as for a fluence of
The TC defines charges with a low kinetic energy as defined by the lifetime of the signal. With the increase of the fluence and the passing of the LIDT (
![]()
Figure 2.Transient currents recorded during fs irradiation of  (a) and
  (b) films.
Based on our data, the target compensation current is always significantly larger than the LP. The difference is understandable as the ionization degree for fs-laser-produced plasma is often low, with an important quantity of the ablated material being in the form of ionized fragments, clusters and nanoparticles. This contribution to the LP signal is difficult to differentiate due to the physical limitations of the diagnostics method. Also, while the LP collects the charges from a rather small solid angle of the irradiated surface, the TC collects the total target compensation charge. The results are in line with the reports[35] where the breakdown of the graphite sample and the gentle ablation mechanism were discussed. This mechanism is characteristic of the low fluence regime and is defined by the breakdown of the sample into larger components with a low degree of ionization.
Further analysis of the ablated ion and electronic cloud in the above LIDT fluence range is performed by implementing the approach reported in Ref. [36] and treating the time of arrival in a shifted Maxwell Boltzmann distribution paradigm. An example of the outcome after this treatment is seen in Figure 3, where the ion and electron charge density are represented for irradiation at
![]()
Figure 3.Calculated ion (a) and electron densities (b) ejected from the  films upon fs-laser irradiation above the ablation threshold fluence.
The electron charge density energy distribution presents maxima at low energies around two orders of magnitude lower than the ones derived for the ions. The difference is understandable, as the electrons are easily scattered during expansion and thus lose a major part of their energy. The structure of the fs plasma also needs to be considered when investigating the electron change distribution function. According to Ref. [37], the material ablated upon fs-laser irradiation contains a major nanoparticle (NP) component expanding with low kinetic energy, which contains the majority of the ablated materials and will strongly influence the electron dynamics.
In our previous work[20], we have shown that LP signal can be used to quantify the ablation threshold value by using the average current representation as a function of the laser fluence. Here we expand the procedure by analyzing the variation of the ejected charge (Figure 4(a)) and the sample compensation charge (Figure 4(b)) as a function of laser fluence. These parameters are proportional to the overall ablated material and represent a measure of the LIDT limit. The ejected charges are considerably low in the 10
![]()
Figure 4.LP total collected charge (a) and target total emitted charge (b) as functions of the laser fluence calculated for  films.
The LIDT value is considered here as the intersection of the charge increase slope with the baseline defined by the low irradiation regime. For the example displayed in Figure 4 for the
The samples were investigated optically both in situ and ex situ and the results are shown in Figure 5. This figure shows the
![]()
Figure 5.(a)  and
and  irradiated samples recorded before irradiation (left), after the 1-on-1 (middle) and after the R-on-1 LIDT damage tests (right). The color bar of (a) maps the local fluence (
 ) inferred from energy measurement and pixel values.
The results presented in Figure 5(a) show clear spatial modulations and light scattering related to the damage while the input fluence is increased. Thus, the spatial modulations observed within this method offer clear information about both threshold damage and permanent damage, but cannot estimate the subthreshold differences.
In Figure 6 there is a comparative representation of the LIDT values determined using the ex situ microscopy technique and the LP-TC approach proposed here. It can be observed that as an overall trend, the single-pulse LP-TC values are lower than the safe value proposed for the multipulse value determined from ex situ microscopy. This difference is seen as an increase in the detection sensitivity by a factor of 2.5 for
![]()
Figure 6.Comparison of the LIDT values determined from  (a) and
  (b) films fabricated in 0.8 Pa
  .
.
The ex situ optical microscopy method only validates the threshold after clear destruction of the films by discoloration[41], surface modification[42], filamentation[43] or crater formation[40]. All of these mechanisms are preceded by electron emission from the film; thus, the LP-TC in the single-shot irradiation approach is designed to have increased sensitivity. Let us note the difference between the value determined by the LP versus the TCs. The threshold value determined by the TCs, induced by a charge imbalance at the film surface, has a 1.3 increase in sensitivity compared with the LP data. This difference is given by the dependence of the LP approach on the probe–film distance and the evaporation solid angle of the electrons, an aspect discussed in detail by our group in Ref. [44].
When extending the LP approach to samples produced in various oxygen pressures, the LP-TC limit is always found to be lower than the 1000 pulse optical value. While the effect of
![]()
Figure 7.LIDT value calculated from  and
and  samples.
![]()
Figure 8.Comparison between the LIDT fluence predicted for a very large number of shots and the value obtained with electrical measurements, for films of  (a) and
  (b) obtained in different oxygen background pressures. The LIDT values determined by the irradiation of one site with multiple laser pulses are shown with dots. The solid lines are obtained by fitting these values with an analytical function. The dashed horizontal lines indicate the values obtained with electrical methods.
The presence of oxygen defects leads to a decrease in the bandgap value as well as the LIDT determined by ex situ optical microscopy[45]. When comparing the data derived for all the irradiated samples (Figures 7(a) and (b)), we observe a correlation between the oxygen pressure used during the deposition of the samples and the LIDT value. The highest LIDT values were found for the deposition in 1 Pa of
In order to confirm that the values found by the LP-TC method are relevant to the LIDT phenomena in the context of high-power infrastructures, the results were compared with the theoretical extrapolation fitting equation defined in ISO 21254-2:2011(E)[48]. The LIDT fluence
The extrapolation curve is related to three fitting parameters, namely
The LIDT values determined by the LP-TC method were integrated into the context of Equation (2) through
4. Conclusion
An alternative method for LIDT estimation is presented here based on a combination of an LP and compensation current measurement. The method was implemented for fs irradiation of
References
[1] F. Lureau, G. Matras, O. Chalus, C. Derycke, T. Morbieu, C. Radier, O. Casagrande, S. Laux, S. Ricaud, G. Rey, A. Pellegrina, C. Richard, L. Boudjemaa, C. Simon-Boisson, A. Baleanu, R. Banici, A. Gradinariu, C. Caldararu, B. D. Boisdeffre, P. Ghenuche, A. Naziru, G. Kolliopoulos, L. Neagu, R. Dabu, I. Dancus, D. Ursescu. High Power Laser Sci. Eng., 8, e43(2020).
[2] C. Radier, O. Chalus, M. Charbonneau, S. Thambirajah, G. Deschamps, S. David, J. Barbe, E. Etter, G. Matras, S. Ricaud, V. Leroux, C. Richard, F. Lureau, A. Baleanu, R. Banici, A. Gradinariu, C. Caldararu, C. Capiteanu, A. Naziru, B. Diaconescu, V. Iancu, R. Dabu, D. Ursescu, I. Dancus, C. Alexandru Ur, K. A. Tanaka, N. V. Zamfir. High Power Laser Sci. Eng., 10, e21(2022).
[3] G. Mourou, S. Mironov, E. Khazanov, A. Sergeev. Eur. Phys. J. Spec. Top., 223, 1181(2014).
[4] P.-G. Bleotu, J. Wheeler, S. Y. Mironov, V. Ginzburg, M. Masruri, A. Naziru, R. Secareanu, D. Ursescu, F. Perez, J. De Sousa, D. Badarau, E. Veuillot, P. Audebert, E. Khazanov, G. Mourou. High Power Laser Sci. Eng., 11, e30(2023).
[5] J. Wheeler, G. P. Bleotu, A. Naziru, R. Fabbri, M. Masruri, R. Secareanu, D. M. Farinella, G. Cojocaru, R. Ungureanu, E. Baynard, J. Demailly, M. Pittman, R. Dabu, I. Dancus, D. Ursescu, D. Ros, T. Tajima, G. Mourou. Photonics, 9, 715(2022).
[6] P.-G. Bleotu, J. Wheeler, D. Papadopoulos, M. Chabanis, J. Prudent, M. Frotin, L. Martin, N. Lebas, A. Freneaux, A. Beluze, F. Mathieu, P. Audebert, D. Ursescu, J. Fuchs, G. Mourou. High Power Laser Sci. Eng., 10, e9(2022).
[7] D. Ashkenasi, M. Lorenz, R. Stoian, A. Rosenfeld. Appl. Surface Sci., 150, 101(1999).
[8] P. Mannion, J. Magee, E. Coyne, G. O’Connor, T. Glynn. Appl. Surface Sci., 233, 275(2004).
[9] A. Melninkaitis, J. Mirauskas, M. Jeskevic, V. Sirutkaitis, B. Mangote, X. Fu, M. Zerrad, L. Gallais, M. Commandré, T. Tolenis, S. Kičas, R. Drazdys. Optical Interference Coatings, FA6(2010).
[10] B. Mangote, L. Gallais, M. Commandré, M. Mende, L. Jensen, H. Ehlers, M. Jupé, D. Ristau, A. Melninkaitis, J. Mirauskas, V. Sirutkaitis, S. Kičas, T. Tolenis, R. Drazdys. Opt. Lett., 37, 1478(2012).
[11] X. Fu, A. Melnikaitis, L. Gallais, S. Kiáčas, R. Drazdys, V. Sirutkaitis, M. Commandré. Opt. Express, 20, 26089(2012).
[12] A. Hanuka, K. P. Wootton, Z. Wu, K. Soong, I. V. Makasyuk, R. J. England, L. Schächter. High Power Laser Sci. Eng., 7, e7(2019).
[13] D. N. Nguyen, L. A. Emmert, D. Patel, C. S. Menoni, W. Rudolph. Appl. Phys. Lett., 97, 191909(2010).
[14] S. Papernov, M. D. Brunsman, J. B. Oliver, B. N. Hoffman, A. A. Kozlov, S. G. Demos, A. Shvydky, F. H. M. Cavalcante, L. Yang, C. S. Menoni, B. Roshanzadeh, S. T. P. Boyd, L. A. Emmert, W. Rudolph. Opt. Express, 26, 17608(2018).
[15] S. Mao, F. Quéré, S. Guizard, X. Mao, R. Russo, G. Petite, P. Martin. Appl. Phys. A, 79, 1695(2004).
[16] Technical Committee: ISO/TC 172/SC 9 Laser and electro-optical systems, “ISO 21254-4:2011 Lasers and laser-related equipment — Test methods for laser-induced damage threshold — Part 4: Inspection, detection and measurement,” ISO ().(2021).
[17] T. Somoskoi, C. Vass, M. Mero, R. Mingesz, Z. Bozoki, K. Osvay. Laser Phys., 25, 056002(2015).
[18] Y. Liu, Y. Brelet, Z. He, L. Yu, S. Mitryukovskiy, A. Houard, B. Forestier, A. Couairon, A. Mysyrowicz. Phys. Rev. Lett., 110, 097601(2013).
[19] B. Rethfeld. Phys. Rev. B, 73, 035101(2006).
[20] R. Udrea, S. A. Irimiciuc, V. Craciun. Materials, 16, 536(2023).
[21] S. A. Irimiciuc, S. Gurlui, G. Bulai, P. Nica, M. Agop, C. Focsa. Appl. Surface Sci., 417, 108(2017).
[22] K. K. Anoop, M. P. Polek, R. Bruzzese, S. Amoruso, S. S. Harilal. J. Appl. Phys., 117, 083108(2015).
[23] S. Fourmaux, J. C. Kieffer. Quantum Electron., 51, 751(2021).
[24] J. Chen, J. G. Lunney, T. Lippert, A. Ojeda-G-P, D. Stender, C. W. Schneider, A. Wokaun. J. Appl. Phys., 116, 073303(2014).
[25] T. Willemsen, T. Willemsen, U. Chaulagain, U. Chaulagain, I. Havlíčková, I. Havlíčková, S. Borneis, S. Borneis, W. Ebert, H. Ehlers, M. Gauch, T. Groß, D. Kramer, T. Laštovička, J. Nejdl, B. Rus, K. Schrader, T. Tolenis, F. Vaněk, P. K. Velpula, S. Weber. Opt. Express, 30, 6129(2022).
[26] G. Velişa, R. F. Andrei, I. Burducea, A. Enciu, D. Iancu, D. A. Mirea, A. Spiridon, M. Straticiuc. Eur. Phys. J. Plus, 136, 1171(2021).
[27] I. Burducea, M. Straticiuc, D. G. Ghiţă, D. V. Moşu, C. I. Călinescu, N. C. Podaru, D. J. W. Mous, I. Ursu, N. V. Zamfir. Nucl. Instrum. Methods Phys. Res. Sect. B, 359, 12(2015).
[28] G. P. Bleotu, A. Naziru, A. H. Okukura, S. Popa, D. Matei, A. Dumitru, C. Alexe, V. P. Iancu, A.-M. Talposi, V. C. Musat, I. Dancus, L. P. Caratas, B. Boisdeffre, T. Samoskoi, J. Takahisa, J. Wheeler, G. Mourou, D. Ursescu. Proc. SPIE, 12300(2022).
[29] L. Gallais, J.-Y. Natoli. Appl. Opt., 42, 960(2003).
[30] V. Volodin, Y. Cheng, A. Bulgakov, Y. Levy, J. Beránek, S. Nagisetty, M. Zukerstein, A. Popov, N. Bulgakova. Opt. Laser Technol., 161, 109161(2023).
[31] E. G. Gamaly, A. V. Rode, V. T. Tikhonchuk, B. Luther-Davies. Appl. Surface Sci., 699(2002).
[32] N. M. Bulgakova, A. N. Panchenko, V. P. Zhukov, S. I. Kudryashov, A. Pereira, W. Marine, T. Mocek, A. V. Bulgakov. Micromachines, 5, 1344(2014).
[33] L. Volfová, S. Andrei Irimiciuc, S. Chertopalov, P. Hruška, J. Čížek, M. Vondráček, M. Novotný, M. Butterling, M. O. Liedke, A. Wagner, J. Lancok. Appl. Surface Sci., 608, 155128(2023).
[34] S. A. Irimiciuc, S. Chertopalov, J. Bulíř, M. Vondracek, L. Fekete, P. Jiricek, M. Novotný, V. Craciun, J. Lancok. Plasma Processes Polymers, 19, 2100102(2022).
[35] N. Bulgakova, A. Bulgakov. Appl. Phys. A, 73, 199(2001).
[36] J. R. Patterson, J. A. Emig, K. B. Fournier, P. P. Jenkins, K. M. Trautz, S. W. Seiler, J. F. Davis. Rev. Sci. Instrum., 83, 10D725(2012).
[37] A. M. Elsied, N. C. Termini, P. K. Diwakar, A. Hassanein. Sci. Rep., 6, 38256(2016).
[38] X. T. Zu, X. Q. Chen, W. G. Zheng, X. D. Jiang, X. D. Yuan, X. P. Li, X. Xiang. Nucl. Instrum. Methods Phys. Res. Sect. B, 266, 3195(2008).
[39] L. Yuan, Y. Zhao, J. Shao. Chin. Opt. Lett., 5, S257(2007).
[40] S. Chen, Y. Zhao, Z. Yu, Z. Fang, D. Li, H. He, J. Shao. Appl. Opt., 51, 6188(2012).
[41] P. K. Velpula, D. Kramer, B. Rus. Coatings, 10, 603(2020).
[42] L. Gallais, B. Mangote, M. Commandré, M. Mende, L. Jensen, H. Ehlers, M. Jupé, D. Ristau, A. Melninkaitis, V. Sirutkaitis, S. Kičas, T. Tolenis, R. Drazdys. Proc. SPIE, 8530(2012).
[43] J. Wen, M. Zhu, Y. Chai, T. Liu, J. Shi, W. Du, J. Shao. J. Alloys Compounds, 957, 170352(2023).
[44] S. A. Irimiciuc, S. Chertopalov, V. Craciun, M. Novotný, J. Lancok. Plasma Processes Polymers, 17, 2000136(2020).
[45] S. Jena, R. B. Tokas, S. Tripathi, K. D. Rao, D. V. Udupa, S. Thakur, N. K. Sahoo. J. Alloys Compounds, 771, 373(2019).
[46] S. Venkataiah, S. J. Chandra, U. Chalapathi, C. Ramana, S. Uthanna. Surface Interface Anal., 53, 206(2021).
[47] L. A. Emmert, M. Mero, W. Rudolph. J. Appl. Phys., 108, 043523(2010).
[48] Technical Committee: ISO/TC 172/SC 9 Laser and electro-optical systems, “ISO 21254-2:2011 Lasers and laser-related equipment — Test methods for laser-induced damage threshold — Part 2: Threshold determination,” ISO ().(2021).

Set citation alerts for the article
Please enter your email address
© Copyright 2018-2021 | Chinese Laser Press. All Rights Reserved 沪ICP备15018463号-20