• Journal of Geographical Sciences
  • Vol. 30, Issue 11, 1802 (2020)
Jinchuan HUANG1、2、*, Ying NA1、2, and Yu GUO1、2、3
Author Affiliations
  • 1Institute of Geographic Sciences and Natural Resources Research, CAS, Beijing 100101, China
  • 2College of Resources and Environment, University of Chinese Academy of Sciences, Beijing 100049, China
  • 3School of Ecology Technology and Engineering, Shanghai Institute of Technology, Shanghai 201418, China
  • show less
    DOI: 10.1007/s11442-020-1813-9 Cite this Article
    Jinchuan HUANG, Ying NA, Yu GUO. Spatiotemporal characteristics and driving mechanism of the coupling coordination degree of urbanization and ecological environment in Kazakhstan[J]. Journal of Geographical Sciences, 2020, 30(11): 1802 Copy Citation Text show less
    Urbanization and ecological environmental systems indexes and trends for the coupling coordination degree at the national scale in Kazakhstan
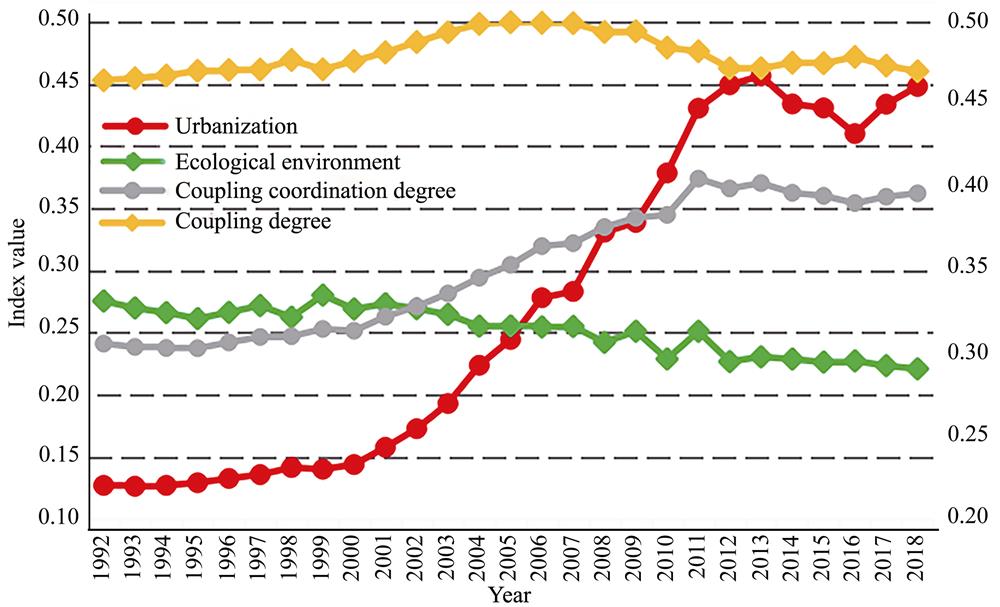
    Fig. 1. Urbanization and ecological environmental systems indexes and trends for the coupling coordination degree at the national scale in Kazakhstan
    Urbanization and ecological environmental systems index values and trends for the coupling coordination degree within the oblasts of Kazakhstan
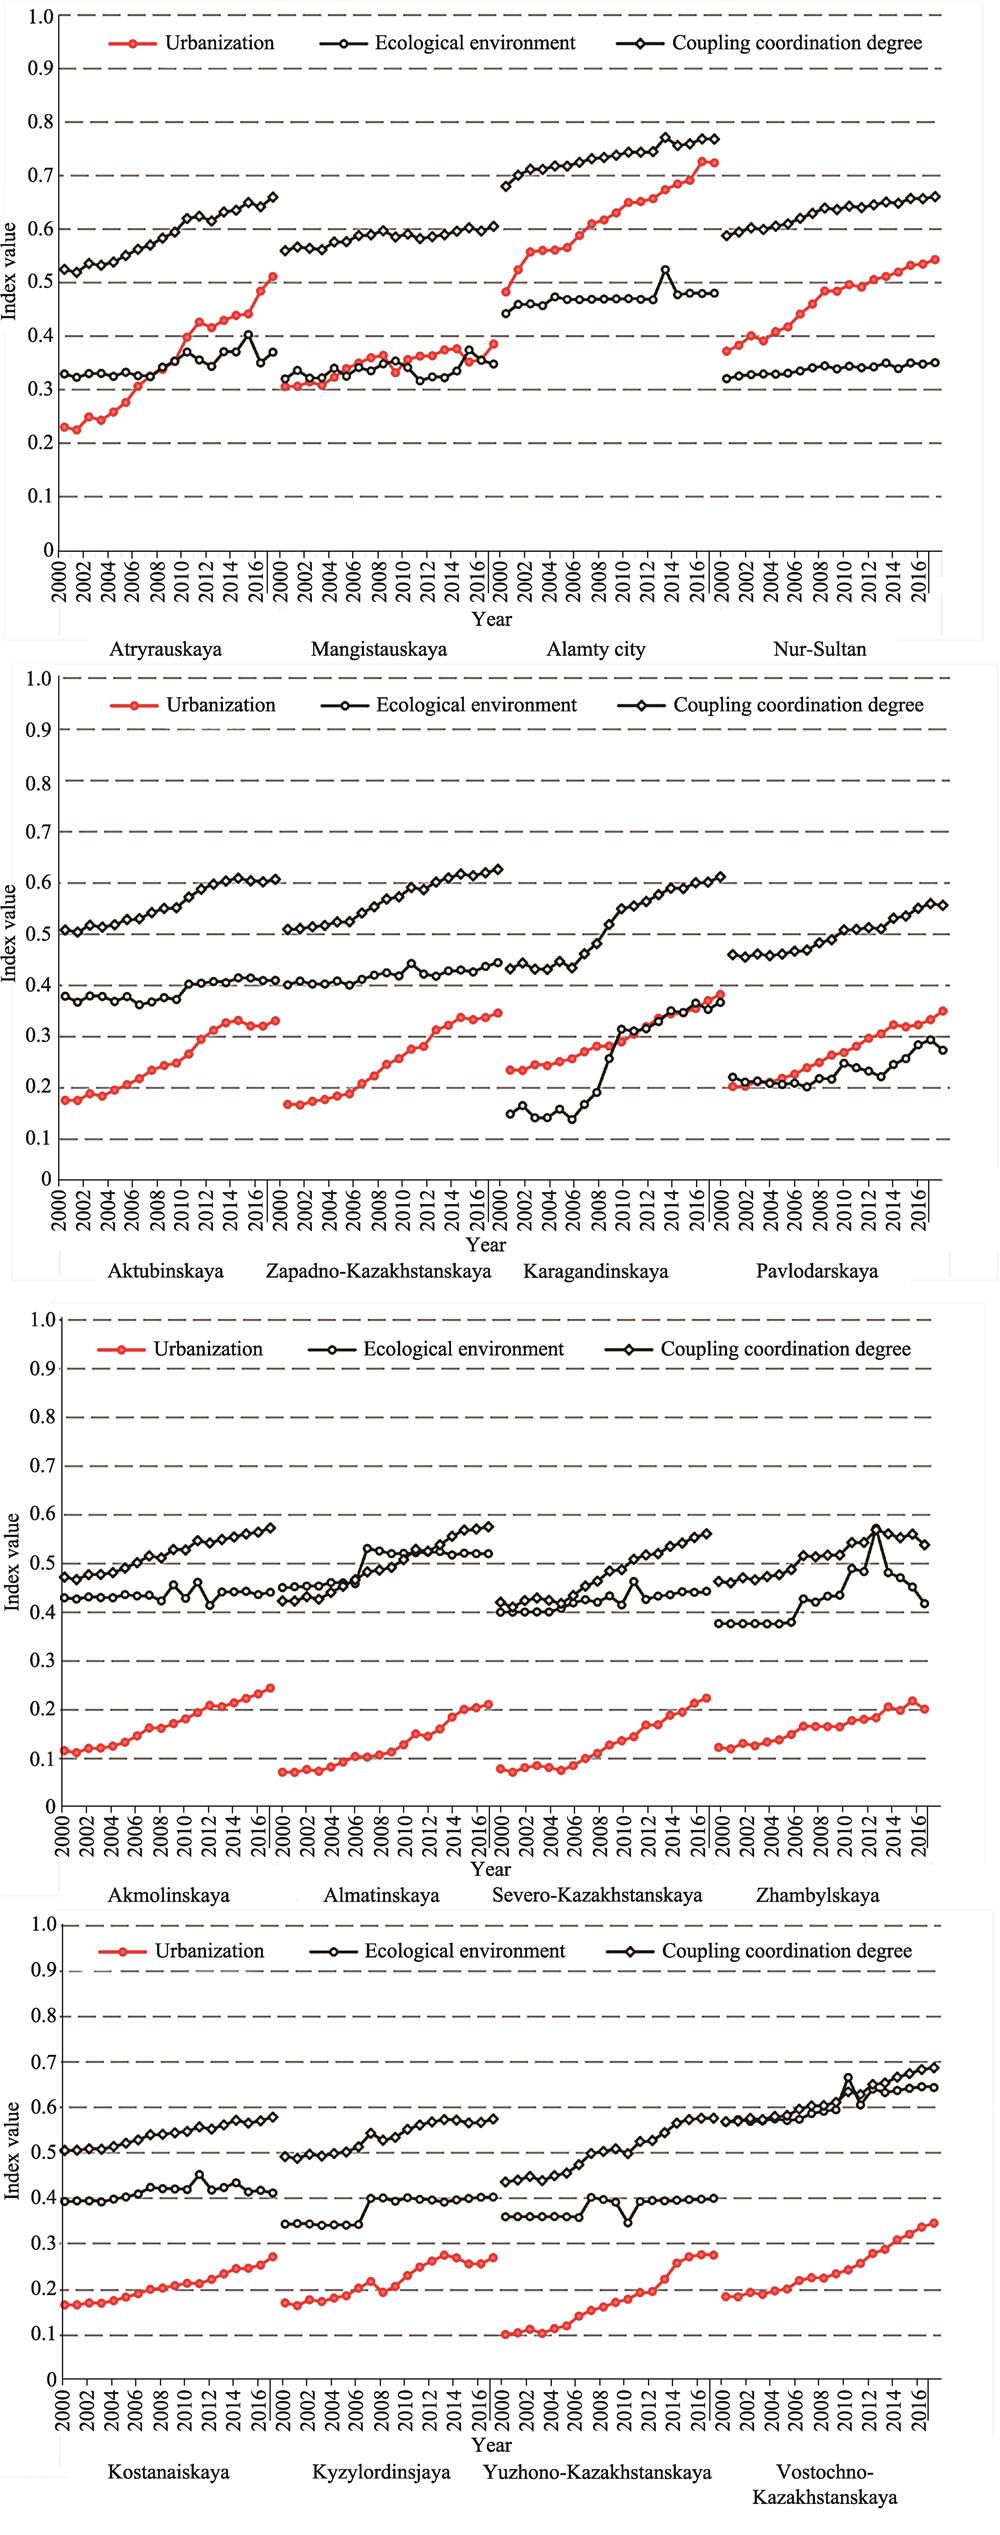
    Fig. 2. Urbanization and ecological environmental systems index values and trends for the coupling coordination degree within the oblasts of Kazakhstan
    Spatiotemporal evolution of the comprehensive urbanization index within the oblasts of Kazakhstan from 2000 to 2017
    Fig. 3. Spatiotemporal evolution of the comprehensive urbanization index within the oblasts of Kazakhstan from 2000 to 2017
    Spatiotemporal evolution of the comprehensive ecological environment index within the oblasts of Kazakhstan from 2000 to 2017
    Fig. 4. Spatiotemporal evolution of the comprehensive ecological environment index within the oblasts of Kazakhstan from 2000 to 2017
    Spatiotemporal evolution of the coupling coordination degree within the oblasts of Kazakhstan from 2000 to 2017
    Fig. 5. Spatiotemporal evolution of the coupling coordination degree within the oblasts of Kazakhstan from 2000 to 2017
    First-level indexWeightBasic-level indexEntropy weightCoefficient of variation weightComprehensive weight
    Population urbanization0.108Urban population (% of total)0.4990.5430.521
    Employment in industry and services (% of total employment)0.5010.4570.479
    Spatial urbanization0.504Urban population density (person/km2)0.4690.4290.451
    Percentage of built-up areas in total land area (%)0.4310.3960.416
    Number of built-up areas per 10,000 people (km2)0.0400.0860.059
    Density of road network per 10,000 people (km2)0.0610.0900.074
    Economic urbanization0.247GDP per capita (USD)0.2580.2540.257
    Industry and services, value added (% of GDP)0.0270.0670.043
    Gross industrial output value per capita (USD)0.3930.3520.374
    Per capita social fixed assets investment0.3220.3270.326
    Social urbanization0.140Per capita income and consumption expense0.2930.2840.290
    Number of public buses per 10,000 people0.2810.2950.289
    Number of college students per 10,000 people0.1320.1820.156
    Number of professional doctors per 10,000 people0.2930.2380.265
    Table 1.

    Index system for urbanization.

    First-level indexWeightBasic-level indexEntropy weightCoefficient of variation weightComprehensive weight
    Ecological environmental status0.357Renewable internal freshwater resources per capita (m2)0.3740.2920.332
    Arable land area (ha per person)0.3040.3440.325
    Cereal production per capita (metric kg)0.3230.3630.344
    Ecological environmental attributes0.170Forest area (% of land area)0.6370.6240.631
    Ecological land per capita (m2)0.3630.3760.369
    Ecological environmental pressure0.363Emissions of solid pollutants (kg per capita)0.3460.3190.332
    Emissions of liquid and gaseous pollutant substances (kg per capita)0.3190.3220.321
    Emissions of free air pollutants, from non-stationary sources (kg per capita)0.3350.3590.347
    Ecological environmental response0.110Running expenses for ecological environmental protection (thousand tenge)0.4380.2610.346
    Removal rate of pollutants (%)0.2330.2340.238
    Recycling rate of pollutants (%)0.3290.5050.416
    Table 2.

    Index system for ecological environment.

    Primary division of developmental stagesSecondary division of developmental stagesTertiary division of developmental stagesCode
    Uncoordinated0<D≤0.2Severe imbalanceE(y)-U(x)>0.1Uncoordinated; urbanization is blockedI1
    |E(y)-U(x)|≤0.1Balanced developmentI2
    E(y)-U(x)<-0.1Uncoordinated; ecological environment is blockedI3
    0.2<D≤0.4Moderate imbalanceE(y)-U(x)>0.1Low-level coordination; urbanization is blockedII1
    |E(y)-U(x)|≤0.1Balanced developmentII2
    E(y)-U(x)<-0.1Low-level coordination; ecological environment is blockedII3
    Transition period0.4<D≤0.6Low coordinationE(y)-U(x)>0.1Basic coordination; urbanization is blockedIII1
    |E(y)-U(x)|≤0.1Balanced developmentIII2
    E(y)-U(x)<-0.1Basic coordination; ecological environment is blockedIII3
    0.6<D≤0.8Moderate coordinationE(y)-U(x)>0.1High-level coordination; urbanization is blockedIV1
    |E(y)-U(x)|≤0.1Balanced developmentIV2
    E(y)-U(x)<-0.1High-level coordination; ecological environment is blockedIV3
    Highly coordinated period0.8<D≤1Advanced coordinationE(y)-U(x)>0.1Uncoordinated; urbanization is blockedV1
    |E(y)-U(x)|≤0.1Balanced developmentV2
    E(y)-U(x)<-0.1Uncoordinated; ecological environment is blockedV3
    Table 3.

    Classification of the synergistic development of urbanization and ecological environment.

    Region200020012002200320042005200620072008200920102011201220132014201520162017
    Akmolinskaya0.4710.4660.4760.4760.4800.4900.5000.5140.5100.5280.5270.5460.5410.5480.5530.5600.5630.572
    Aktubinskaya0.5080.5040.5170.5130.5180.5280.5300.5420.5500.5510.5720.5870.5970.6030.6090.6040.6020.607
    Almatinskaya0.4000.4220.4310.4250.4390.4520.4650.4820.4850.4910.5070.5280.5240.5370.5550.5680.5700.574
    Atyrauskaya0.5240.5190.5350.5320.5380.5500.5620.5700.5830.5940.6190.6240.6150.6320.6350.6490.6410.659
    Zapadno- Kazakhstanskaya0.5090.5100.5140.5160.5230.5240.5410.5530.5680.5720.5910.5870.6010.6090.6170.6140.6190.626
    Zhambylskaya0.4620.4590.4700.4650.4720.4760.4860.5150.5130.5160.5160.5420.5420.5680.5600.5520.5590.537
    Karagandinskaya0.4320.4430.4310.4310.4460.4340.4610.4810.5180.5490.5550.5630.5770.5890.5890.6000.6010.612
    Kostanaiskaya0.5040.5050.5080.5070.5130.5200.5280.5390.5400.5430.5460.5560.5510.5600.5710.5640.5690.577
    Kyzylordinskaya0.4910.4870.4960.4920.4980.5010.5120.5420.5270.5330.5510.5600.5670.5720.5710.5650.5660.573
    Mangistauskaya0.5590.5660.5640.5610.5760.5760.5880.5890.5970.5850.5900.5820.5860.5890.5960.6020.5960.605
    Yuzhno- Kazakhstanskaya0.4350.4390.4470.4380.4490.4550.4730.4980.5020.5080.4970.5240.5260.5430.5640.5720.5750.575
    Pavlodarskaya0.4600.4550.4610.4580.4610.4660.4680.4830.4890.5080.5090.5120.5100.5300.5350.5500.5590.556
    Severo-Kazakhstanskaya0.4000.4090.4230.4280.4230.4170.4330.4520.4620.4830.4860.5070.5160.5190.5340.5410.5520.560
    Vostochno-Kazakhstanskaya0.5680.5690.5750.5720.5790.5810.5950.6020.6030.6100.6330.6270.6490.6530.6650.6730.6820.686
    Nur-Sultan city0.5870.5940.6020.5990.6050.6090.6200.6290.6390.6360.6430.6400.6450.6500.6480.6570.6560.660
    Almaty city0.6790.7000.7110.7110.7180.7170.7240.7310.7330.7380.7430.7430.7440.7710.7560.7590.7680.768
    Table 4.

    Summary of the coupling coordination degree of urbanization and ecological environment within the oblasts of Kazakhstan from 2000 to 2017

    Region200020012002200320042005200620072008200920102011201220132014201520162017
    AkmolinskayaⅢ1Ⅲ1Ⅲ1Ⅲ1Ⅲ1Ⅲ1Ⅲ1Ⅲ1Ⅲ1Ⅲ1Ⅲ1Ⅲ1Ⅲ1Ⅲ1Ⅲ1Ⅲ1Ⅲ1Ⅲ1
    AktubinskayaⅢ1Ⅲ1Ⅲ1Ⅲ1Ⅲ1Ⅲ1Ⅲ1Ⅲ1Ⅲ1Ⅲ1Ⅲ1Ⅲ1Ⅲ2Ⅳ2Ⅳ2Ⅳ2Ⅳ2Ⅳ2
    AlmatinskayaⅡ1Ⅲ1Ⅲ1Ⅲ1Ⅲ1Ⅲ1Ⅲ1Ⅲ1Ⅲ1Ⅲ1Ⅲ1Ⅲ1Ⅲ1Ⅲ1Ⅲ1Ⅲ1Ⅲ1Ⅲ1
    AtyrauskayaⅢ2Ⅲ2Ⅲ2Ⅲ2Ⅲ2Ⅲ2Ⅲ2Ⅲ2Ⅲ2Ⅲ2Ⅳ2Ⅳ2Ⅳ2Ⅳ2Ⅳ2Ⅳ2Ⅳ3Ⅳ3
    Zapadno-KazakhstanskayaⅢ1Ⅲ1Ⅲ1Ⅲ1Ⅲ1Ⅲ1Ⅲ1Ⅲ1Ⅲ1Ⅲ1Ⅲ1Ⅲ1Ⅳ1Ⅳ1Ⅳ2Ⅳ2Ⅳ2Ⅳ2
    ZhambylskayaⅢ1Ⅲ1Ⅲ1Ⅲ1Ⅲ1Ⅲ1Ⅲ1Ⅲ1Ⅲ1Ⅲ1Ⅲ1Ⅲ1Ⅲ1Ⅲ1Ⅲ1Ⅲ1Ⅲ1Ⅲ1
    KaragandinskayaⅢ2Ⅲ2Ⅲ3Ⅲ3Ⅲ2Ⅲ3Ⅲ3Ⅲ2Ⅲ2Ⅲ2Ⅲ2Ⅲ2Ⅲ2Ⅲ2Ⅲ2Ⅲ2Ⅳ2Ⅳ2
    KostanaiskayaⅢ1Ⅲ1Ⅲ1Ⅲ1Ⅲ1Ⅲ1Ⅲ1Ⅲ1Ⅲ1Ⅲ1Ⅲ1Ⅲ1Ⅲ1Ⅲ1Ⅲ1Ⅲ1Ⅲ1Ⅲ1
    KyzylordinskayaⅢ1Ⅲ1Ⅲ1Ⅲ1Ⅲ1Ⅲ1Ⅲ1Ⅲ1Ⅲ1Ⅲ1Ⅲ1Ⅲ1Ⅲ1Ⅲ1Ⅲ1Ⅲ1Ⅲ1Ⅲ1
    MangistauskayaⅢ2Ⅲ2Ⅲ2Ⅲ2Ⅲ2Ⅲ2Ⅲ2Ⅲ2Ⅲ2Ⅲ2Ⅲ2Ⅲ2Ⅲ2Ⅲ2Ⅲ2Ⅳ2Ⅲ2Ⅳ2
    Yuzhno-KazakhstanskayaⅢ1Ⅲ1Ⅲ1Ⅲ1Ⅲ1Ⅲ1Ⅲ1Ⅲ1Ⅲ1Ⅲ1Ⅲ1Ⅲ1Ⅲ1Ⅲ1Ⅲ1Ⅲ1Ⅲ1Ⅲ1
    PavlodarskayaⅢ2Ⅲ2Ⅲ2Ⅲ2Ⅲ2Ⅲ2Ⅲ2Ⅲ2Ⅲ2Ⅲ2Ⅲ2Ⅲ2Ⅲ2Ⅲ2Ⅲ2Ⅲ2Ⅲ2Ⅲ2
    Severo-KazakhstanskayaⅡ1Ⅲ1Ⅲ1Ⅲ1Ⅲ1Ⅲ1Ⅲ1Ⅲ1Ⅲ1Ⅲ1Ⅲ1Ⅲ1Ⅲ1Ⅲ1Ⅲ1Ⅲ1Ⅲ1Ⅲ1
    Vostochno-KazakhstanskayaⅢ1Ⅲ1Ⅲ1Ⅲ1Ⅲ1Ⅲ1Ⅲ1Ⅳ1Ⅳ1Ⅳ1Ⅳ1Ⅳ1Ⅳ1Ⅳ1Ⅳ1Ⅳ1Ⅳ1Ⅳ1
    Nurs-Sultan cityⅢ2Ⅲ2Ⅳ2Ⅲ2Ⅳ2Ⅳ2Ⅳ3Ⅳ3Ⅳ3Ⅳ3Ⅳ3Ⅳ3Ⅳ3Ⅳ3Ⅳ3Ⅳ3Ⅳ3Ⅳ3
    Almaty cityⅣ2Ⅳ2Ⅳ2Ⅳ3Ⅳ2Ⅳ2Ⅳ3Ⅳ3Ⅳ3Ⅳ3Ⅳ3Ⅳ3Ⅳ3Ⅳ3Ⅳ3Ⅳ3Ⅳ3Ⅳ3
    Table 5.

    Classification table of the coupling coordination degree of urbanization and ecological environment within the oblasts of Kazakhstan from 2000 to 2017 (for details of the codes used here refer to Table 3)

    Dominant interaction factorqDominant interaction factorqDominant interaction factorq
    Employment in industry and services (% of total employment) ∩ GDP per capita0.709Cereal production per capita ∩ Urban population (% of total)0.717Recycling rate of pollutants ∩ Employment in industry and services (% of total employment)0.713
    Employment in industry and services (% of total employment) ∩ Gross industrial output value per capita0.703Cereal production per capita ∩ Employment in industry and services (% of total employment)0.752Emissions of liquid and gasiform pollutant substances ∩ Employment in industry and services (% of total employment)0.787
    Employment in industry and services (% of total employment) ∩ Social fixed asset investment per capita0.705Ecological land per capita ∩ GDP per capita0.743Emissions of solid pollutants ∩ Employment in industry and services (% of total employment)0.762
    Employment in industry and services (% of total employment) ∩ Number of public buses per 10,000 people0.704Ecological land per capita ∩ Employment in industry and services (% of total employment)0.731Emissions of free air pollutants, divergent from stationary sources ∩ Employment in industry and services (% of total employment)0.803
    Employment in industry and services (% of total employment) ∩ Number of built-up areas per 10,000 people0.758Forest areas (% of land area) ∩ Employment in industry and services (% of total employment)0.788Emissions of liquid and gasiform pollutant substances ∩ Gross industrial output value per capita0.751
    Per capita income and consumption expenses ∩ Employment in industry and services (% of total employment)0.721Forest area (% of land area) ∩ GDP per capita0.758Emissions of liquid and gasiform pollutant substances ∩ Social fixed asset investment per capita0.753
    Number of public buses per 10,000 people ∩ Employment in industry and services (% of total employment)0.750Forest area (% of land area) ∩ Urban population (% of total)0.748Emissions of free air pollutants from non-stationary sources ∩ Gross industrial output value per capita0.717
    Number of college students per 10,000 people ∩ GDP per capita0.731Forest area (% of land area) ∩ Number of college students per 10,000 people0.729Emissions of free air pollutants from non-stationary sources ∩ social fixed asset investment per capita0.711
    Number of college students per 10,000 people ∩ social fixed asset investment per capita0.711Forest area (% of land area) ∩ Arable land area (hectares per person)0.716Emissions of free air pollutants from non-stationary sources ∩ Urban population (% of total)0.717
    Number of college students per 10,000 people ∩ Number of public buses per 10,000 people0.720Running expenses for environmental protection ∩ Urban population0.756Emissions of free air pollutants from non-stationary sources ∩ Urban population (% of total)0.704
    Number of college students per 10,000 people ∩ Employment in industry and services0.783Running expenses on environmental protection ∩ Employment in industry and services0.739
    Number of college students per 10,000 people ∩ Per capita income and consumption expenses0.712Running expenses on environmental protection ∩ Number of college students per 10,000 people0.751
    Number of college students per 10,000 people ∩ Number of public buses per 10,000 people0.784Purification rate of pollutants ∩ Employment in industry and services0.726
    Table 6.

    Dominant interaction factors affecting the harmony between urbanization and ecological environment in Kazakhstan

    Jinchuan HUANG, Ying NA, Yu GUO. Spatiotemporal characteristics and driving mechanism of the coupling coordination degree of urbanization and ecological environment in Kazakhstan[J]. Journal of Geographical Sciences, 2020, 30(11): 1802
    Download Citation