
Jinchuan HUANG, Ying NA, Yu GUO. Spatiotemporal characteristics and driving mechanism of the coupling coordination degree of urbanization and ecological environment in Kazakhstan[J]. Journal of Geographical Sciences, 2020, 30(11): 1802
- Journal of Geographical Sciences
- Vol. 30, Issue 11, 1802 (2020)
Abstract
Keywords
1 Introduction
Central Asia is located at the junction between Europe and Asia and is a transportation hub for the Eurasian continent. The ancient Silk Road traverses Central Asia, and modern Central Asia is also the strategic core area of the Silk Road Economic Belt (
Since the beginning of the new century, Central Asia has ushered in new development opportunities. Both economic development and urbanization levels are increasing in the region. According to the law of global urban expansion, the urbanization levels of the five Central Asian countries will continue to increase. However, Central Asia, which lies deep in the middle of the Eurasian continent, is the main body of the Eurasian inland arid zone. It is one of the most arid regions in the world and the carrying capacity of the environment is very limited (
For ecologically fragile areas, such as arid areas, the coordinated development of urbanization and the ecological environment is essential for regional sustainable development. Kazakhstan, which accounts for 68% of Central Asia’s land area, has developed from a major agricultural economy to a major energy and mineral resource development country in recent years. The pace of social and economic development has accelerated. It has entered a rapid industrialization track before the other four countries, and the speed of urbanization has also accelerated. From an urbanization development model led by traditional industrialization, the urbanization rate of Kazakhstan has long ranked first among the five Central Asian countries, reaching more than 50%. According to the general law of urbanization development in various countries around the world, when a country’s urbanization level reaches 40% to 60%, it is considered to be urbanized. Economic development in Kazakhstan has entered the golden period, and the country is also facing a period with the frequent occurrence of “urban diseases” (
2 Literature review
The process of urbanization has caused increasingly serious negative effects worldwide, leading to a far-reaching impact on ecological environment (
Although there has been little empirical research on urbanization and the impact on ecological environment in many countries, a large number of multi-scale studies, including the state (
In summary, researchers have studied the interaction and coupling of urbanization and ecological environment in China, but fewer such studies have been conducted elsewhere in the world. Much research has been conducted on the “one-to-one” and “two-element” interactive coupling between urbanization and ecological environment, with fewer studies on the coordination of “multi-element” coupling. As the first country in Central Asia to transform its economy, Kazakhstan is now experiencing rapid urbanization. How to manage the conflict between urbanization and the ecological environment has become an important issue regarding social development in this region. Therefore, this study applied data for both human and natural elements in Kazakhstan to research the processes of dynamic change in urbanization and ecological environment of Kazakhstan at province and national scales, and the coupling coordination degree between these two complex systems were assessed by constructing a coupling coordination degree model. A geographical detector was used to analyze the interaction between urbanization and various elements of the complex system in Kazakhstan, with the main control factors affecting the coordination degree being quantitatively identified. Finally, corresponding countermeasures and suggestions are proposed, which will provide a scientific reference for the coordination and sustainable development of urbanization and ecological environment in arid regions such as Kazakhstan and Central Asia, and ensure the prosperity and development of the “Belt and Road" region.
3 Research area, data sources, and an evaluation index system
3.1 Study area and data sources
Administratively, the territory of Kazakhstan is divided into 14 regions, consisting of districts and settlements. In addition, two cities, Almaty and Nur-Sultan, are classified as having republican significance. Considering its geographical location and socio-economic characteristics, the Kazakhstan region has traditionally been referred to as five macro areas: northern (Akmolinskaya, Kostanaiskaya, Pavlodarskaya, Severo-Kazakhstanskaya), central (Karagandinskaya), eastern (Vostochno-Kazakhstanskaya), western (Aktubinskaya, Atyrauskaya, Mangistauskaya, Zapadno-Kazakhstanskaya), and southern (Almatinskaya, Yuzhno- Kazakhstanskaya, Kyzylordinskaya, Zhambylskaya).
Socio-economic and environmental data for the Kazakhstan region at the oblast scale (from 2000 to 2017) and country scale (from 1992 to 2018) were used in this study, all of which were obtained from the official website of the Kazakhstan statistics bureau( Due to the availability of data, we only obtained relevant data at the state scale for Kazakhstan from 2000 to 2017, while the data obtained at the national scale are from 1992 to 2018.) (The State Statistics Bureau of Kazakhstan,
3.2 The evaluation index system
To determine the coordination degree between urbanization and ecological environment in Central Asia, an indicator system for urbanization and ecological environment was constructed based on previous literature (
| First-level index | Weight | Basic-level index | Entropy weight | Coefficient of variation weight | Comprehensive weight |
|---|---|---|---|---|---|
| Population | 0.108 | Urban population (% of total) | 0.499 | 0.543 | 0.521 |
| Employment in industry and services (% of total employment) | 0.501 | 0.457 | 0.479 | ||
| Spatial | 0.504 | Urban population density (person/km2) | 0.469 | 0.429 | 0.451 |
| Percentage of built-up areas in total land area (%) | 0.431 | 0.396 | 0.416 | ||
| Number of built-up areas per 10,000 people (km2) | 0.040 | 0.086 | 0.059 | ||
| Density of road network per 10,000 people (km2) | 0.061 | 0.090 | 0.074 | ||
| Economic | GDP per capita (USD) | 0.258 | 0.254 | 0.257 | |
| Industry and services, value added (% of GDP) | 0.027 | 0.067 | 0.043 | ||
| Gross industrial output value per capita (USD) | 0.393 | 0.352 | 0.374 | ||
| Per capita social fixed assets investment | 0.322 | 0.327 | 0.326 | ||
| Social | 0.140 | Per capita income and consumption expense | 0.293 | 0.284 | 0.290 |
| Number of public buses per 10,000 people | 0.281 | 0.295 | 0.289 | ||
| Number of college students per 10,000 people | 0.132 | 0.182 | 0.156 | ||
| Number of professional doctors per 10,000 people | 0.293 | 0.238 | 0.265 |
Table 1.
Index system for urbanization.
| First-level index | Weight | Basic-level index | Entropy weight | Coefficient of variation weight | Comprehensive weight |
|---|---|---|---|---|---|
| Ecological | 0.357 | Renewable internal freshwater resources per capita (m2) | 0.374 | 0.292 | 0.332 |
| Arable land area (ha per person) | 0.304 | 0.344 | 0.325 | ||
| Cereal production per capita (metric kg) | 0.323 | 0.363 | 0.344 | ||
| Ecological | 0.170 | Forest area (% of land area) | 0.637 | 0.624 | 0.631 |
| Ecological land per capita (m2) | 0.363 | 0.376 | 0.369 | ||
| Ecological | 0.363 | Emissions of solid pollutants (kg per capita) | 0.346 | 0.319 | 0.332 |
| Emissions of liquid and gaseous pollutant substances (kg per capita) | 0.319 | 0.322 | 0.321 | ||
| Emissions of free air pollutants, from non-stationary sources (kg per capita) | 0.335 | 0.359 | 0.347 | ||
| Ecological | 0.110 | Running expenses for ecological environmental protection (thousand tenge) | 0.438 | 0.261 | 0.346 |
| Removal rate of pollutants (%) | 0.233 | 0.234 | 0.238 | ||
| Recycling rate of pollutants (%) | 0.329 | 0.505 | 0.416 |
Table 2.
Index system for ecological environment.
4 Research methods
The commonly used weighting methods mainly include the expert investigation method (Delphi method), the analytic hierarchy process (AHP), the binomial coefficient method, the principal component analysis method, the entropy method, the deviation and mean square error method, the multi-objective programming method, and the projection tracking model. The entropy method has been widely used to define index weights in geography and environmental science and reflects the validity of information provided by the index. It reflects the original information of the index and improves the objectivity of the evaluation.
As the original data were not comparable due to the large differences of dimensional and units, standardization of the data range was used to make data being dimensionless. The original index was therefore divided into two: the positive index and negative index. The larger the positive index, the more favorable it was for the development of the system (conversely, the larger the negative index, the more unfavorable it was). To eliminate the deviation of a single objective weighting method and to avoid the arbitrariness and error of the subjective weighting method, the entropy method and variation coefficient method were combined in this study to ensure the accuracy and reliability of the results.
where
The calculated weights of urbanization and ecological environmental system evaluation indexes are shown in Tables 1 and 2. The comprehensive weight of the indicators was calculated as follows:
where
4.1 Comprehensive evaluation model
The subsystems of population urbanization, economic urbanization, social urbanization, and spatial urbanization; and ecological environmental status, ecological environmental attributes, ecological environmental pressure, and ecological environmental response were calculated using the linear weighting method.
The evaluation of the index values of urbanization and ecological environmental system was calculated as follows:
where
4.2 An urbanization and ecological environmental coordination model
Coupling refers to the phenomenon in which two (or more) systems are affected by the various interactions between them and the outside world. The coupling degree model (5), which depicts the relationship between a pair of parameters, is widely used to study the interaction between urbanization and ecological environment.
We further constructed the coupling coordination degree model for urbanization and ecological environment to identify the degree of coordination between the coupling of urbanization and ecological environment, namely:
where
The coupling degree between urbanization and ecological environment can be divided into three main stages of development, each of which can be further divided into four sub-categories (
| Primary division of | Secondary division of developmental stages | Tertiary division of developmental stages | Code | ||
|---|---|---|---|---|---|
| Uncoordinated | 0<D≤0.2 | Severe imbalance | E(y)-U(x)>0.1 | Uncoordinated; urbanization is blocked | I1 |
| |E(y)-U(x)|≤0.1 | Balanced development | I2 | |||
| E(y)-U(x)<-0.1 | Uncoordinated; ecological environment is blocked | I3 | |||
| 0.2<D≤0.4 | Moderate imbalance | E(y)-U(x)>0.1 | Low-level coordination; urbanization is blocked | II1 | |
| |E(y)-U(x)|≤0.1 | Balanced development | II2 | |||
| E(y)-U(x)<-0.1 | Low-level coordination; ecological environment is blocked | II3 | |||
| Transition period | 0.4<D≤0.6 | Low coordination | E(y)-U(x)>0.1 | Basic coordination; urbanization is blocked | III1 |
| |E(y)-U(x)|≤0.1 | Balanced development | III2 | |||
| E(y)-U(x)<-0.1 | Basic coordination; ecological environment is blocked | III3 | |||
| 0.6<D≤0.8 | Moderate coordination | E(y)-U(x)>0.1 | High-level coordination; urbanization is blocked | IV1 | |
| |E(y)-U(x)|≤0.1 | Balanced development | IV2 | |||
| E(y)-U(x)<-0.1 | High-level coordination; ecological environment is blocked | IV3 | |||
| Highly coordinated period | 0.8<D≤1 | Advanced coordination | E(y)-U(x)>0.1 | Uncoordinated; urbanization is blocked | V1 |
| |E(y)-U(x)|≤0.1 | Balanced development | V2 | |||
| E(y)-U(x)<-0.1 | Uncoordinated; ecological environment is blocked | V3 | |||
Table 3.
Classification of the synergistic development of urbanization and ecological environment.
4.3 Geographical detector
Geographical detectors were originally applied to assess the environmental risks to health (
5 Results
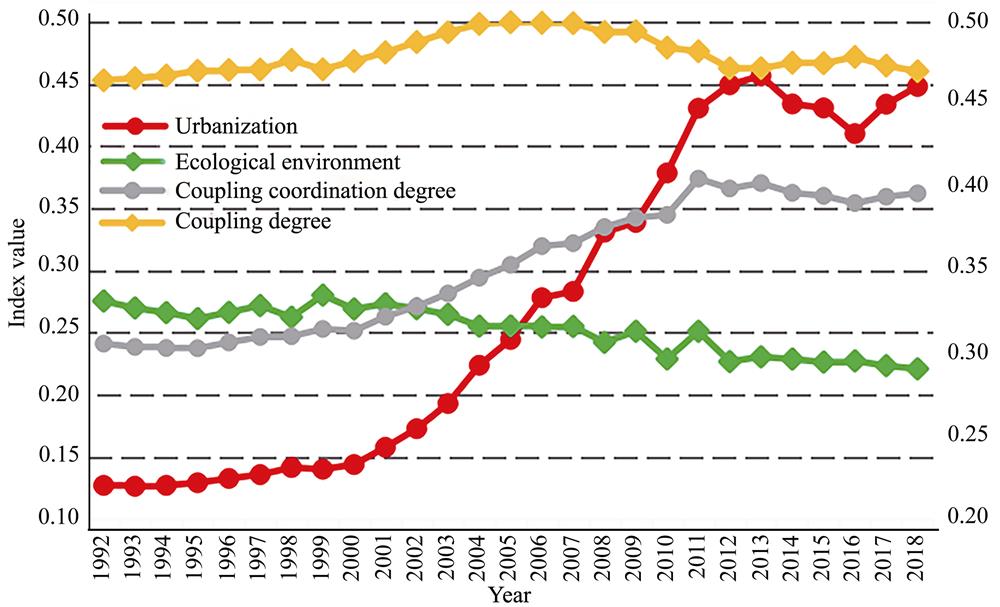
5.1 Evolution of the coupling coordination degree between urbanization and ecological environmental systems at the national scale in Kazakhstan
In this study, the original data at the national scale for Kazakhstan were standardized, and the trends of the coupling degree and coupling coordination degree between urbanization and ecological environment were calculated according to the coupling degree and coupling coordination degree formulas, respectively (
![]()
Figure 1.
5.2 Spatiotemporal evolution of the urbanization and ecological environmental systems and their interactions within the oblasts of Kazakhstan
5.2.1 The spatiotemporal evolution of the comprehensive urbanization index within the oblasts of Kazakhstan
A statistical chart (
![]()
Figure 2.
As shown in
![]()
Figure 3.
5.2.2 The spatiotemporal evolution of the comprehensive ecological environment index within the oblasts of Kazakhstan
Over time, the comprehensive ecological environment index of all regions of Kazakhstan displayed a fluctuating upward trend, indicating that Kazakhstan's overall ecological environment level has improved, but the overall increase has been small (
![]()
Figure 4.
5.2.3 Spatiotemporal evolution of the interaction between the urbanization system and the ecological environmental system within the oblasts of Kazakhstan
The coupling coordination degree between the urbanization and ecological environment can be used to reflect not only the correlation between systems but also the size of the system index (
| Region | 2000 | 2001 | 2002 | 2003 | 2004 | 2005 | 2006 | 2007 | 2008 | 2009 | 2010 | 2011 | 2012 | 2013 | 2014 | 2015 | 2016 | 2017 |
|---|---|---|---|---|---|---|---|---|---|---|---|---|---|---|---|---|---|---|
| Akmolinskaya | 0.471 | 0.466 | 0.476 | 0.476 | 0.480 | 0.490 | 0.500 | 0.514 | 0.510 | 0.528 | 0.527 | 0.546 | 0.541 | 0.548 | 0.553 | 0.560 | 0.563 | 0.572 |
| Aktubinskaya | 0.508 | 0.504 | 0.517 | 0.513 | 0.518 | 0.528 | 0.530 | 0.542 | 0.550 | 0.551 | 0.572 | 0.587 | 0.597 | 0.603 | 0.609 | 0.604 | 0.602 | 0.607 |
| Almatinskaya | 0.400 | 0.422 | 0.431 | 0.425 | 0.439 | 0.452 | 0.465 | 0.482 | 0.485 | 0.491 | 0.507 | 0.528 | 0.524 | 0.537 | 0.555 | 0.568 | 0.570 | 0.574 |
| Atyrauskaya | 0.524 | 0.519 | 0.535 | 0.532 | 0.538 | 0.550 | 0.562 | 0.570 | 0.583 | 0.594 | 0.619 | 0.624 | 0.615 | 0.632 | 0.635 | 0.649 | 0.641 | 0.659 |
| Zapadno- Kazakhstanskaya | 0.509 | 0.510 | 0.514 | 0.516 | 0.523 | 0.524 | 0.541 | 0.553 | 0.568 | 0.572 | 0.591 | 0.587 | 0.601 | 0.609 | 0.617 | 0.614 | 0.619 | 0.626 |
| Zhambylskaya | 0.462 | 0.459 | 0.470 | 0.465 | 0.472 | 0.476 | 0.486 | 0.515 | 0.513 | 0.516 | 0.516 | 0.542 | 0.542 | 0.568 | 0.560 | 0.552 | 0.559 | 0.537 |
| Karagandinskaya | 0.432 | 0.443 | 0.431 | 0.431 | 0.446 | 0.434 | 0.461 | 0.481 | 0.518 | 0.549 | 0.555 | 0.563 | 0.577 | 0.589 | 0.589 | 0.600 | 0.601 | 0.612 |
| Kostanaiskaya | 0.504 | 0.505 | 0.508 | 0.507 | 0.513 | 0.520 | 0.528 | 0.539 | 0.540 | 0.543 | 0.546 | 0.556 | 0.551 | 0.560 | 0.571 | 0.564 | 0.569 | 0.577 |
| Kyzylordinskaya | 0.491 | 0.487 | 0.496 | 0.492 | 0.498 | 0.501 | 0.512 | 0.542 | 0.527 | 0.533 | 0.551 | 0.560 | 0.567 | 0.572 | 0.571 | 0.565 | 0.566 | 0.573 |
| Mangistauskaya | 0.559 | 0.566 | 0.564 | 0.561 | 0.576 | 0.576 | 0.588 | 0.589 | 0.597 | 0.585 | 0.590 | 0.582 | 0.586 | 0.589 | 0.596 | 0.602 | 0.596 | 0.605 |
| Yuzhno- Kazakhstanskaya | 0.435 | 0.439 | 0.447 | 0.438 | 0.449 | 0.455 | 0.473 | 0.498 | 0.502 | 0.508 | 0.497 | 0.524 | 0.526 | 0.543 | 0.564 | 0.572 | 0.575 | 0.575 |
| Pavlodarskaya | 0.460 | 0.455 | 0.461 | 0.458 | 0.461 | 0.466 | 0.468 | 0.483 | 0.489 | 0.508 | 0.509 | 0.512 | 0.510 | 0.530 | 0.535 | 0.550 | 0.559 | 0.556 |
| Severo-Kazakhstanskaya | 0.400 | 0.409 | 0.423 | 0.428 | 0.423 | 0.417 | 0.433 | 0.452 | 0.462 | 0.483 | 0.486 | 0.507 | 0.516 | 0.519 | 0.534 | 0.541 | 0.552 | 0.560 |
| Vostochno-Kazakhstanskaya | 0.568 | 0.569 | 0.575 | 0.572 | 0.579 | 0.581 | 0.595 | 0.602 | 0.603 | 0.610 | 0.633 | 0.627 | 0.649 | 0.653 | 0.665 | 0.673 | 0.682 | 0.686 |
| Nur-Sultan city | 0.587 | 0.594 | 0.602 | 0.599 | 0.605 | 0.609 | 0.620 | 0.629 | 0.639 | 0.636 | 0.643 | 0.640 | 0.645 | 0.650 | 0.648 | 0.657 | 0.656 | 0.660 |
| Almaty city | 0.679 | 0.700 | 0.711 | 0.711 | 0.718 | 0.717 | 0.724 | 0.731 | 0.733 | 0.738 | 0.743 | 0.743 | 0.744 | 0.771 | 0.756 | 0.759 | 0.768 | 0.768 |
Table 4.
Summary of the coupling coordination degree of urbanization and ecological environment within the oblasts of Kazakhstan from 2000 to 2017
In terms of the spatiotemporal differentiation of the coupling coordination degree between urbanization and ecological environment in Kazakhstan, the states mainly had a low-moderate level of coordination and were at the stage of transformation and development. In terms of spatial distribution, the coordination level of the east, middle, and west of the country was higher than that of the south and north (
![]()
Figure 5.
| Region | 2000 | 2001 | 2002 | 2003 | 2004 | 2005 | 2006 | 2007 | 2008 | 2009 | 2010 | 2011 | 2012 | 2013 | 2014 | 2015 | 2016 | 2017 |
|---|---|---|---|---|---|---|---|---|---|---|---|---|---|---|---|---|---|---|
| Akmolinskaya | Ⅲ1 | Ⅲ1 | Ⅲ1 | Ⅲ1 | Ⅲ1 | Ⅲ1 | Ⅲ1 | Ⅲ1 | Ⅲ1 | Ⅲ1 | Ⅲ1 | Ⅲ1 | Ⅲ1 | Ⅲ1 | Ⅲ1 | Ⅲ1 | Ⅲ1 | Ⅲ1 |
| Aktubinskaya | Ⅲ1 | Ⅲ1 | Ⅲ1 | Ⅲ1 | Ⅲ1 | Ⅲ1 | Ⅲ1 | Ⅲ1 | Ⅲ1 | Ⅲ1 | Ⅲ1 | Ⅲ1 | Ⅲ2 | Ⅳ2 | Ⅳ2 | Ⅳ2 | Ⅳ2 | Ⅳ2 |
| Almatinskaya | Ⅱ1 | Ⅲ1 | Ⅲ1 | Ⅲ1 | Ⅲ1 | Ⅲ1 | Ⅲ1 | Ⅲ1 | Ⅲ1 | Ⅲ1 | Ⅲ1 | Ⅲ1 | Ⅲ1 | Ⅲ1 | Ⅲ1 | Ⅲ1 | Ⅲ1 | Ⅲ1 |
| Atyrauskaya | Ⅲ2 | Ⅲ2 | Ⅲ2 | Ⅲ2 | Ⅲ2 | Ⅲ2 | Ⅲ2 | Ⅲ2 | Ⅲ2 | Ⅲ2 | Ⅳ2 | Ⅳ2 | Ⅳ2 | Ⅳ2 | Ⅳ2 | Ⅳ2 | Ⅳ3 | Ⅳ3 |
| Zapadno-Kazakhstanskaya | Ⅲ1 | Ⅲ1 | Ⅲ1 | Ⅲ1 | Ⅲ1 | Ⅲ1 | Ⅲ1 | Ⅲ1 | Ⅲ1 | Ⅲ1 | Ⅲ1 | Ⅲ1 | Ⅳ1 | Ⅳ1 | Ⅳ2 | Ⅳ2 | Ⅳ2 | Ⅳ2 |
| Zhambylskaya | Ⅲ1 | Ⅲ1 | Ⅲ1 | Ⅲ1 | Ⅲ1 | Ⅲ1 | Ⅲ1 | Ⅲ1 | Ⅲ1 | Ⅲ1 | Ⅲ1 | Ⅲ1 | Ⅲ1 | Ⅲ1 | Ⅲ1 | Ⅲ1 | Ⅲ1 | Ⅲ1 |
| Karagandinskaya | Ⅲ2 | Ⅲ2 | Ⅲ3 | Ⅲ3 | Ⅲ2 | Ⅲ3 | Ⅲ3 | Ⅲ2 | Ⅲ2 | Ⅲ2 | Ⅲ2 | Ⅲ2 | Ⅲ2 | Ⅲ2 | Ⅲ2 | Ⅲ2 | Ⅳ2 | Ⅳ2 |
| Kostanaiskaya | Ⅲ1 | Ⅲ1 | Ⅲ1 | Ⅲ1 | Ⅲ1 | Ⅲ1 | Ⅲ1 | Ⅲ1 | Ⅲ1 | Ⅲ1 | Ⅲ1 | Ⅲ1 | Ⅲ1 | Ⅲ1 | Ⅲ1 | Ⅲ1 | Ⅲ1 | Ⅲ1 |
| Kyzylordinskaya | Ⅲ1 | Ⅲ1 | Ⅲ1 | Ⅲ1 | Ⅲ1 | Ⅲ1 | Ⅲ1 | Ⅲ1 | Ⅲ1 | Ⅲ1 | Ⅲ1 | Ⅲ1 | Ⅲ1 | Ⅲ1 | Ⅲ1 | Ⅲ1 | Ⅲ1 | Ⅲ1 |
| Mangistauskaya | Ⅲ2 | Ⅲ2 | Ⅲ2 | Ⅲ2 | Ⅲ2 | Ⅲ2 | Ⅲ2 | Ⅲ2 | Ⅲ2 | Ⅲ2 | Ⅲ2 | Ⅲ2 | Ⅲ2 | Ⅲ2 | Ⅲ2 | Ⅳ2 | Ⅲ2 | Ⅳ2 |
| Yuzhno-Kazakhstanskaya | Ⅲ1 | Ⅲ1 | Ⅲ1 | Ⅲ1 | Ⅲ1 | Ⅲ1 | Ⅲ1 | Ⅲ1 | Ⅲ1 | Ⅲ1 | Ⅲ1 | Ⅲ1 | Ⅲ1 | Ⅲ1 | Ⅲ1 | Ⅲ1 | Ⅲ1 | Ⅲ1 |
| Pavlodarskaya | Ⅲ2 | Ⅲ2 | Ⅲ2 | Ⅲ2 | Ⅲ2 | Ⅲ2 | Ⅲ2 | Ⅲ2 | Ⅲ2 | Ⅲ2 | Ⅲ2 | Ⅲ2 | Ⅲ2 | Ⅲ2 | Ⅲ2 | Ⅲ2 | Ⅲ2 | Ⅲ2 |
| Severo- | Ⅱ1 | Ⅲ1 | Ⅲ1 | Ⅲ1 | Ⅲ1 | Ⅲ1 | Ⅲ1 | Ⅲ1 | Ⅲ1 | Ⅲ1 | Ⅲ1 | Ⅲ1 | Ⅲ1 | Ⅲ1 | Ⅲ1 | Ⅲ1 | Ⅲ1 | Ⅲ1 |
| Vostochno- | Ⅲ1 | Ⅲ1 | Ⅲ1 | Ⅲ1 | Ⅲ1 | Ⅲ1 | Ⅲ1 | Ⅳ1 | Ⅳ1 | Ⅳ1 | Ⅳ1 | Ⅳ1 | Ⅳ1 | Ⅳ1 | Ⅳ1 | Ⅳ1 | Ⅳ1 | Ⅳ1 |
| Nurs-Sultan city | Ⅲ2 | Ⅲ2 | Ⅳ2 | Ⅲ2 | Ⅳ2 | Ⅳ2 | Ⅳ3 | Ⅳ3 | Ⅳ3 | Ⅳ3 | Ⅳ3 | Ⅳ3 | Ⅳ3 | Ⅳ3 | Ⅳ3 | Ⅳ3 | Ⅳ3 | Ⅳ3 |
| Almaty city | Ⅳ2 | Ⅳ2 | Ⅳ2 | Ⅳ3 | Ⅳ2 | Ⅳ2 | Ⅳ3 | Ⅳ3 | Ⅳ3 | Ⅳ3 | Ⅳ3 | Ⅳ3 | Ⅳ3 | Ⅳ3 | Ⅳ3 | Ⅳ3 | Ⅳ3 | Ⅳ3 |
Table 5.
Classification table of the coupling coordination degree of urbanization and ecological environment within the oblasts of Kazakhstan from 2000 to 2017 (for details of the codes used here refer to
5.3 The dominant factors influencing the degree of coordination between Kazakhstan’s urbanization and ecological environmental systems
Geographical spatial factors affect the spatial differentiation of the interaction between urbanization and ecological environment. Based on the calculated coupling coordination degree between urbanization and ecological environment in Kazakhstan, we conducted an equal-isolation and decentralized treatment for 25 indicators of the urbanization and ecological environmental systems. We then input these results into geographical detector software to calculate the
In the ecological environment subsystem, indicators such as farmland areas per capita, availability of water resources per capita, ecological land per capita, and forest coverage were found to be important factors in the coupling coordination degree in Kazakhstan. In oases of arid areas, the influence of water resources on urbanization was the most decisive factor. An uncontrolled escalation of urbanization tends to result in a deterioration of water systems (
This research on Kazakhstan revealed that the interaction between urbanization and ecological environmental factors had a strong influence on the overall degree of coordination, and they also have a strong synergy. Only the pollutant recovery rate index (i.e., the recycling rate of pollutants) and the value added of industry and services (i.e., % of GDP) were independent of each other, and the interaction between urbanization and ecological environment for these parameters was not significant.
| Dominant interaction factor | Dominant interaction factor | Dominant interaction factor | |||
|---|---|---|---|---|---|
| Employment in industry and services (% of total employment) ∩ GDP per capita | 0.709 | Cereal production per capita ∩ Urban population (% of total) | 0.717 | Recycling rate of pollutants ∩ Employment in industry and services (% of total employment) | 0.713 |
| Employment in industry and services (% of total employment) ∩ Gross industrial output value per capita | 0.703 | Cereal production per capita ∩ Employment in industry and services (% of total employment) | 0.752 | Emissions of liquid and gasiform pollutant substances ∩ Employment in industry and services (% of total employment) | 0.787 |
| Employment in industry and services (% of total employment) ∩ Social fixed asset investment per capita | 0.705 | Ecological land per capita ∩ GDP per capita | 0.743 | Emissions of solid pollutants ∩ Employment in industry and services (% of total employment) | 0.762 |
| Employment in industry and services (% of total employment) ∩ Number of public buses per 10,000 people | 0.704 | Ecological land per capita ∩ Employment in industry and services (% of total employment) | 0.731 | Emissions of free air pollutants, divergent from stationary sources ∩ Employment in industry and services (% of total employment) | 0.803 |
| Employment in industry and services (% of total employment) ∩ Number of built-up areas per 10,000 people | 0.758 | Forest areas (% of land area) ∩ Employment in industry and services (% of total employment) | 0.788 | Emissions of liquid and gasiform pollutant substances ∩ Gross industrial output value per capita | 0.751 |
| Per capita income and consumption expenses ∩ Employment in industry and services (% of total employment) | 0.721 | Forest area (% of land area) ∩ GDP per capita | 0.758 | Emissions of liquid and gasiform pollutant substances ∩ Social fixed asset investment per capita | 0.753 |
| Number of public buses per 10,000 people ∩ Employment in industry and services (% of total employment) | 0.750 | Forest area (% of land area) ∩ Urban population (% of total) | 0.748 | Emissions of free air pollutants from non-stationary sources ∩ Gross industrial output value per capita | 0.717 |
| Number of college students per 10,000 people ∩ GDP per capita | 0.731 | Forest area (% of land area) ∩ Number of college students per 10,000 people | 0.729 | Emissions of free air pollutants from non-stationary sources ∩ social fixed asset investment per capita | 0.711 |
| Number of college students per 10,000 people ∩ social fixed asset investment per capita | 0.711 | Forest area (% of land area) ∩ Arable land area (hectares per person) | 0.716 | Emissions of free air pollutants from non-stationary sources ∩ Urban population (% of total) | 0.717 |
| Number of college students per 10,000 people ∩ Number of public buses per 10,000 people | 0.720 | Running expenses for environmental protection ∩ Urban population | 0.756 | Emissions of free air pollutants from non-stationary sources ∩ Urban population (% of total) | 0.704 |
| Number of college students per 10,000 people ∩ Employment in industry and services | 0.783 | Running expenses on environmental protection ∩ Employment in industry and services | 0.739 | ||
| Number of college students per 10,000 people ∩ Per capita income and consumption expenses | 0.712 | Running expenses on environmental protection ∩ Number of college students per 10,000 people | 0.751 | ||
| Number of college students per 10,000 people ∩ Number of public buses per 10,000 people | 0.784 | Purification rate of pollutants ∩ Employment in industry and services | 0.726 |
Table 6.
Dominant interaction factors affecting the harmony between urbanization and ecological environment in Kazakhstan
6 Conclusions and discussion
6.1 Conclusions
In this study, a comprehensive evaluation index system for urbanization and ecological environment in Central Asia was constructed. Taking Kazakhstan as a case study, the spatiotemporal changes of the coupling degree and coupling coordination degree between the comprehensive index of urbanization and ecological environment at the national and state scales were analyzed. A geographical detector model was used to identify the main factors controlling the interaction between urbanization and ecological environment in Kazakhstan. The conclusions can be drawn as follows:
(1) The coupling degree between urbanization and ecological environment in Kazakhstan at the national scale displayed an inverted “U” shaped curve, indicating a pattern of “slow growth - stable growth - fast decline,” while the coupling coordination degree displayed a continuous upward trend.
(2) In recent years, the coupling of urbanization and ecological environment of Kazakhstan has shown an upward trend. For states with a high level of industrialization, the level of urbanization was significantly higher than that of states with a high level of agricultural production. From a spatial perspective, the comprehensive urbanization index values for the western and eastern states were higher than those of the southern and northern states. In terms of the ecological environment, the comprehensive ecological environment index values for each state fluctuated and increased over the study period, but the increases were not large. The comprehensive ecological environment index presented a spatial distribution pattern of being high in the east and west and low in the central region. Except in Karaganda and Pavlodar, the comprehensive ecological environment index was mainly determined by the ecological background.
(3) Overall, the interaction between urbanization and ecological environmental system in the states of Kazakhstan had a relatively low level of coordination, but it displayed a positive development trend. The spatial distribution showed that the coordination level of the east, middle, and west of the country was higher than that of the south and north. The states with good industrialization development were in a moderately well-coordinated state, while in the states where agriculture was the main activity urbanization and ecological environment were poorly coordinated and there was a lack of economic development. The coordination degree in Almaty was the largest in the country.
(4) The investigation and identification of the main factors that affected the coordination degree between urbanization and ecological environment were determined based on a geographic detector model. The indicators of GDP per capita, social fixed asset investment per capita, employment in industry and services (% of total employment), and the number of college students per 10,000 people were important urbanization factors that affected the coupling coordination degree of urbanization and ecological environment in Kazakhstan. The indicators of farmland areas per capita, availability of water resources per capita, ecological land per capita, and forest coverage were important environmental factors that affected the coordination degree between the coupling of urbanization and ecological environment in Kazakhstan. The interaction of each element in the two subsystems had a greater impact on the coupling coordination degree than any single element, and also had a strong synergy.
6.2 Discussion
The ecological environment in Central Asia is fragile, with several prominent ecological problems. The industrial structure is dominated by agriculture and basic energy-based industries, and urbanization is severely restricted by ecological environmental conditions. Kazakhstan has the largest area and total economic output among the five Central Asian countries, as well as the highest level of urbanization and industrialization. The coordinated development of urbanization and protection of ecological environment has had a demonstrable effect on the sustainable development of Central Asia and arid regions elsewhere in the world. This study found that in the past ten years, Kazakhstan has shown a healthy and coordinated developmental trend between urbanization and protection of ecological environment. Some successful developments have occurred, but some problems still exist. Therefore, the following suggestions are proposed for the future development of Kazakhstan.
(1) Kazakhstan is still facing the problem of a lack of urbanization. It is necessary to accelerate the urbanization of the population, space, society, and economy, and narrow the gap between the various subsystems. To achieve a breakthrough in population urbanization, the transformation of the agricultural population from agriculture-based states to urban populations should be actively promoted to improve the population urbanization rate. The rate of infrastructure construction should be increased to improve the population carrying capacity of cities. Ecologically efficient industries should be promoted to replace traditional low-ecological efficient industries and production methods. An accelerated program of industrial upgrading would transform economic development patterns.
(2) Kazakhstan's industry is dominated by traditional oil and gas exploitation, and the ecological environment has been seriously damaged. Therefore, it is necessary to strengthen the environmental protection of resources, improve the efficiency of resource utilization, and gradually increase the carrying capacity of the local ecological environment. Increased investment in environmental protection is necessary, including the establishment of sewage treatment plants and sewage recycling facilities to relieve the pressure on water resources. It is also necessary to expand the area of vegetation cover, including forest areas, and to develop and use land rationally, whilst also remediating damaged land resources.
(3) The opportunity offered by the “Belt and Road” construction project should be seized to further accelerate the transformation and upgrading of the country’s industrial structure. The industrial chain could be extended in terms of the traditional petrochemical industry by progressing from crude oil extraction to deep processing. The development potential of renewable energy should be exploited to develop clean energy. The introduction of professional talent is needed together with an improvement in the level of education. High-tech industries should be cultivated and developed, and tertiary industry should be developed in an appropriate manner.
References
[1] BaoC, FangC L. Scenario warning and analysis of water resources constraint intensity on urbanization in arid area. Journal of Natural Resources, 23, 239-244(2009).
[2] BergerA R, HodgeR A. Natural change in the environment: A challenge to the pressure-state-response concept. Social Indicators Research, 44, 255-265(1998).
[3] BuyantuyevA, WuJ, GriesC. Multiscale analysis of the urbanization pattern of the Phoenix Metropolitan landscape of USA: Time, space and thematic resolution. Landscape and Urban Planning, 94, 206-217(2010).
[4] CaoQ W, BaoC, GuC L et al. China’s urbanization SD modelling and simulation based on water resource constraints. Geographical Research, 38, 167-180(2019).
[5] CowanP J. Geographic usage of the terms Middle Asia and Central Asia. Journal of Arid Environments, 69, 359-363(2007).
[6] CuiX G, FangC L, LiuH M et al. Dynamic simulation of urbanization and eco-environment coupling: A review on theory, methods and applications. Journal of Geographical Sciences, 74, 1079-1096(2019).
[7] DengH, ChenY. Influences of recent climate change and human activities on water storage variations in Central Asia. Journal of Hydrology, 544, 46-57(2017).
[8] DuX. The coupling modeling and simulation measure between water resource and environment and socio-economic system: Based on Dongting Lake basin. Economic Geography, 34, 151-155(2014).
[9] DuX, MengY R, FangC L et al. Spatio-temporal characteristics of coupling coordination development between urbanization and eco-environment in Shandong Peninsula urban agglomeration. Acta Ecologica Sinica, 40, 5546-5559(2020).
[10] EisfelderC, KuenzerC, DechS. Derivation of biomass information for semi-arid areas using remote-sensing data. International Journal of Remote Sensing, 33, 2937-2984(2012).
[11] EstoqueR, MurayamaY. Landscape pattern and ecosystem service value changes: Implications for environmental sustainability planning for the rapidly urbanizing summer capital of the Philippines. Landscape and Urban Planning, 116, 60-72(2013).
[12] FanJ, LiP X. Analysis on the future energy consumption and preliminary discussion on carbon emission of China from the perspective urbanization. Advances in Earth Science, 26, 57-65(2011).
[13] FanJ, XuY, WangC et al. The effects of human activities on the ecological environment of Tibet over the past half century. Chinese Science Bulletin, 60, 3057-3066(2015).
[14] FangC L. Ecological Economic Corridor in Western China, 78-86(2004).
[15] FangC L, CuiX G, LiangL W. Theoretical analysis of urbanization and eco-environment coupling coil and coupler control. Acta Geographica Sinica, 74, 2529-2546(2019).
[16] FangC L, GaoQ, ZhangX L. Spatiotemporal characteristics of the expansion of an urban agglomeration and its effect on the eco-environment: Case study on the northern slope of the Tianshan Mountains. Science China Earth Sciences, 62, 1461-1472(2019).
[17] GrossmanG M, KruegerA B. Economic growth and the environment. Quarterly Journal of Economics, 110, 353-377(1995).
[18] GuanH L, ChenJ C, CaoW. Empirical study on the relationship between carbon emission and urbanization. China Population, Resources and Environment, 23, 111-116(2013).
[20] HuangJ C, FangC L. Analysis of coupling mechanism and rules between urbanization and eco-environment. Geographical Research, 22, 211-220(2003).
[21] JiangL L, Guli·J, BaoA M et al. Vegetation dynamics and responses to climate change and human activities in Central Asia. Science of the Total Environment, 599/600, 967-980(2017).
[23] KuangW, MaY G, LiH et al. Analysis of land degradation intensity and trend in Central Asia from 1999 to 2012. Remote Sensing for Land and Resources, 26, 163-169(2014).
[25] LiJ Z, DaiY H, ZhaoW et al. Study on spatial-temporal characteristics of interaction coupling between regional urbanization system and ecosystem and early-warning of coordinated development: A case of Hunan province. Resources and Environment in the Yangtze Basin, 28, 1590-1601(2019).
[27] LiuH M, FangC L, HuangJ C et al. The spatial-temporal characteristics and influencing factors of air pollution in Beijing-Tianjin-Hebei urban agglomeration. Acta Geographica Sinica, 73, 177-191(2018).
[28] LiuH M, FangC L, LiY H et al. The coupled human and natural cube: A conceptual framework for analyzing urbanization and eco-environment interactions. Acta Geographica Sinica, 74, 1489-1507(2019).
[29] LiuH M, ShiP J, YangX M et al. Self-organization evolution simulation and empirical study of human-water system. Journal of Natural Resources, 29, 709-718(2014).
[31] LiuY B, LiR D, SongX F et al. Analysis on the coupling degree of urbanization and ecological environment in China. Journal of Natural Resources, 20, 105-112(2005).
[32] MaS J, WangR S. The social-economic-natural complex ecosystem. Acta Ecologica Sinica, 4, 3-11(1984).
[33] MaY. Examining the coupling degree and interactive stress between urbanization and eco-environment in Yangtze River Economic Belt. Resources and Environment in the Yangtze Basin, 29, 275-286(2020).
[35] Indicators to Measure Decoupling of Environmental Pressure from Economic Growth. Paris: OECD(2002).
[37] QiaoB, FangC. The dynamic coupling model of the harmonious development between urbanization and eco-environment and its application in arid area. Acta Ecologica Sinica, 25, 3003-3009(2005).
[43] WangJ, XuC. Geodetector: Principle and prospective. Acta Geographica Sinica, 72, 116-134(2017).
[44] WangX J, ChenY. Research on the impact mechanism of urbanization on the efficiency of carbon emissions: An empirical analysis based on panel data from 118 countries in the world. World Regional Studies, 29, 503-511(2020).
[51] YangY, LiuY, DongW et al. Spatio-temporal variation analysis of urbanization and land use benefit of oasis urban areas in Xinjiang. Acta Ecologica Sinica, 31, 6568-6578(2011).
[53] ZhangR, JiaoH. Coupling and coordination between urbanization and ecological environment in China. Journal of Arid Land Resources and Environment, 29, 12-17(2015).
[54] ZhangS, ShiP, WangZ et al. Analysis of coupling between urbanization and water resource and environment of inland river basin in arid region: A case study of Shiyang river basin. Economic Geography, 32, 142-148(2012).
[56] ZhaoJ J, LiuY, ZhuY K et al. Spatiotemporal differentiation and influencing factors of the coupling and coordinated development of new urbanization and ecological environment in the Yellow River Basin. Resources Science, 42, 159-171(2020).
[57] ZhengF, LiuG Y, LiuZ Y. Land use change and its coupling relationship with urbanization and industrialization in Xinjiang Uygur Autonomous Region. Research of Soil and Water Conservation, 20, 251-256(2013).


Set citation alerts for the article
Please enter your email address

© Copyright 2018-2021 | Chinese Laser Press. All Rights Reserved 沪ICP备15018463号-20