• Photonics Research
  • Vol. 4, Issue 1, 0007 (2016)
M. Shasti1、*, P. Coutino1, S. Mukherjee1, A. Varanytsia2, T. Smith1, A. P. Luchette1, L. Sukhomlinova1, T. Kosa1, A. Munoz1, and B. Taheri1
Author Affiliations
  • 1AlphaMicron Inc., 1950 State Route 59, Kent, Ohio 44240-4112, USA
  • 2Liquid Crystal Institute, Kent State University, Kent, Ohio 44240-4112, USA
  • show less
    DOI: 10.1364/prj.4.000007 Cite this Article Set citation alerts
    M. Shasti, P. Coutino, S. Mukherjee, A. Varanytsia, T. Smith, A. P. Luchette, L. Sukhomlinova, T. Kosa, A. Munoz, B. Taheri. Reverse mode switching of the random laser emission in dye doped liquid crystals under homogeneous and inhomogeneous electric fields[J]. Photonics Research, 2016, 4(1): 0007 Copy Citation Text show less
    (a) Polarized absorption band of PM597 in Host G NLC. The twin planar liquid crystals cells are rubbed in the direction indicated with the arrow (R, inset). The relative orientation of the sample with respect to the polarization of the incident light (Elight) has been identified as follows: P, rubbing direction; R, parallel to the incident electric field; and PP, rubbing direction perpendicular to the incident electric field. (b) Experimental setup. Configurations A and B are defined by the light source, the sample position. and the detector employed in each case, as described in the text. The linear polarizer (P), the beam splitter (BS), and the focusing lens (L) are common to all configurations.
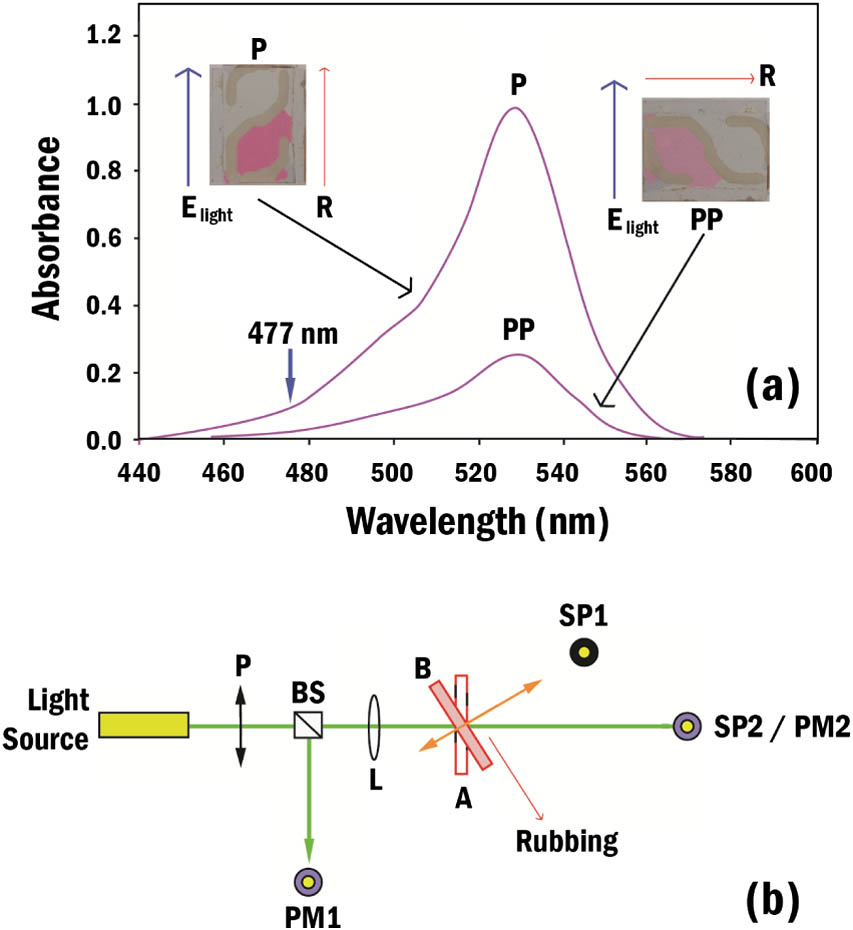
    Fig. 1. (a) Polarized absorption band of PM597 in Host G NLC. The twin planar liquid crystals cells are rubbed in the direction indicated with the arrow (R, inset). The relative orientation of the sample with respect to the polarization of the incident light (Elight) has been identified as follows: P, rubbing direction; R, parallel to the incident electric field; and PP, rubbing direction perpendicular to the incident electric field. (b) Experimental setup. Configurations A and B are defined by the light source, the sample position. and the detector employed in each case, as described in the text. The linear polarizer (P), the beam splitter (BS), and the focusing lens (L) are common to all configurations.
    (a) Characteristic emission band observed from sample AMI-1 (Host G+0.5 wt.% PM597) under CW (black dotted line) and with pulsed (≈0.55 mJ/pulse) laser excitation (continuous red line) at 532 nm in the off state at V=0 V. (b) FWHM and emission intensity (inset) versus pump energy for the ASE.
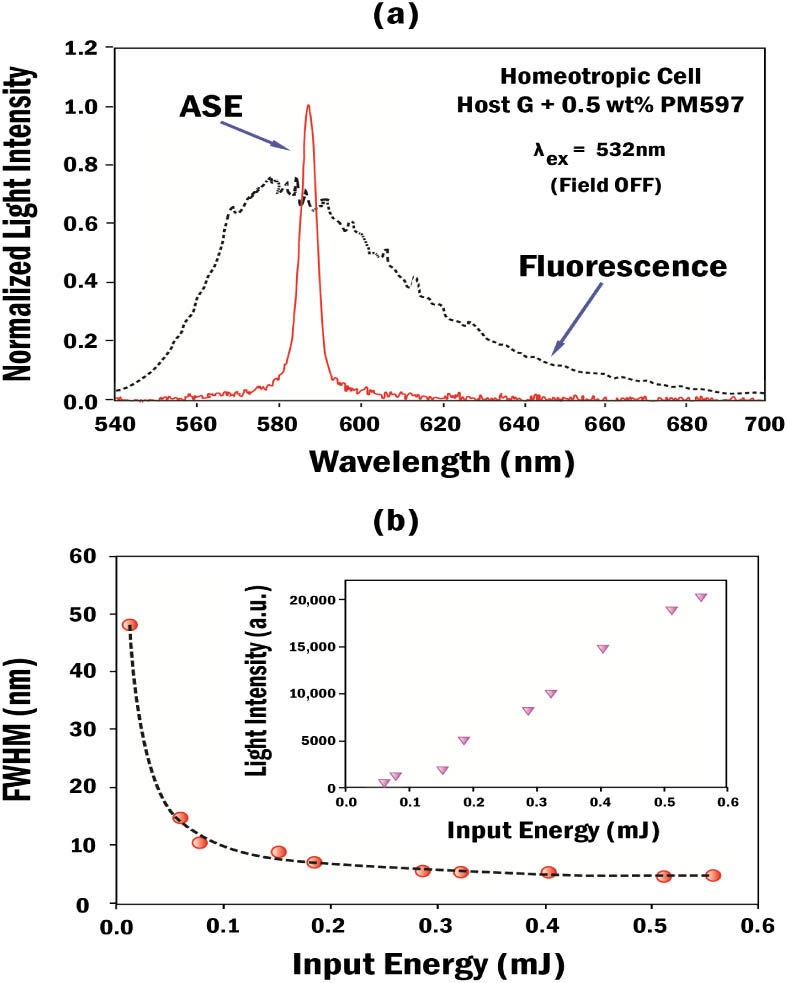
    Fig. 2. (a) Characteristic emission band observed from sample AMI-1 (Host G+0.5wt.% PM597) under CW (black dotted line) and with pulsed (0.55mJ/pulse) laser excitation (continuous red line) at 532 nm in the off state at V=0V. (b) FWHM and emission intensity (inset) versus pump energy for the ASE.
    Light transmission of sample AMI-1 between crossed polarizers (a) at V=0, (b) after 1 min at V=16 V, and (c) after 20 min at V=16 V. (d) Absorbance (at λex=477 nm) versus voltage. (e) Emission spectra and light intensity at 578 nm (inset) versus voltage. The results presented in (d) and (e) correspond to experiments that were performed in our samples after 20 min at the applied voltage indicated in the figure.
    Fig. 3. Light transmission of sample AMI-1 between crossed polarizers (a) at V=0, (b) after 1 min at V=16V, and (c) after 20 min at V=16V. (d) Absorbance (at λex=477nm) versus voltage. (e) Emission spectra and light intensity at 578 nm (inset) versus voltage. The results presented in (d) and (e) correspond to experiments that were performed in our samples after 20 min at the applied voltage indicated in the figure.
    (a) Emission spectra of the sample AMI-2 under pulsed laser of 0.2 mJ/pulse at 0 V (pink line) and 4 V (red line). (b) RL threshold versus voltage in sample AMI-2, and lasing threshold versus the dye concentration in samples AMI-1, AMI-2, and AMI-3 (inset) at V=16 V.
    Fig. 4. (a) Emission spectra of the sample AMI-2 under pulsed laser of 0.2mJ/pulse at 0 V (pink line) and 4 V (red line). (b) RL threshold versus voltage in sample AMI-2, and lasing threshold versus the dye concentration in samples AMI-1, AMI-2, and AMI-3 (inset) at V=16V.
    Crossed polarizers transmission observed in sample AMI-4 at (a) V=0 and (b) V=16 V. (c) Phase-lag profile at V=16 V. (d) Emission spectra (λex=532 nm, 8 ns pulse width, and ∼500 μJ/pulse) in the off state (black) and in the on state at V=16 V (R1, pink dotted line; R2, red continuous line). A black mask was employed [(d), inset], to ensure the input laser excitation on region R2.
    Fig. 5. Crossed polarizers transmission observed in sample AMI-4 at (a) V=0 and (b) V=16V. (c) Phase-lag profile at V=16V. (d) Emission spectra (λex=532nm, 8 ns pulse width, and 500μJ/pulse) in the off state (black) and in the on state at V=16V (R1, pink dotted line; R2, red continuous line). A black mask was employed [(d), inset], to ensure the input laser excitation on region R2.
    M. Shasti, P. Coutino, S. Mukherjee, A. Varanytsia, T. Smith, A. P. Luchette, L. Sukhomlinova, T. Kosa, A. Munoz, B. Taheri. Reverse mode switching of the random laser emission in dye doped liquid crystals under homogeneous and inhomogeneous electric fields[J]. Photonics Research, 2016, 4(1): 0007
    Download Citation