M. Shasti1、*, P. Coutino1, S. Mukherjee1, A. Varanytsia2, T. Smith1, A. P. Luchette1, L. Sukhomlinova1, T. Kosa1, A. Munoz1, and B. Taheri1
Abstract
We report the observation of electric field induced random lasing in a dye doped liquid crystal system. This was achieved by using a liquid crystal host with negative dielectric anisotropy doped with laser dye PM 597 in a 75 μm cell with a homeotropic alignment layer. In the absence of an applied field, only amplified spontaneous emission was observed since the liquid crystal orientation was uniform. However, application of a field resulted in a fieldinduced planar-like configuration with local nonuniformity in liquid crystal orientation. This led to random lasing in the energized state (voltage greater than a transition threshold). The onset of lasing occurs by application of either a spatially homogenous or a spatially inhomogeneous electric field across the liquid crystal. The characteristics of the emission spectra as a function of different (i) dye concentration and (ii) applied voltage were investigated using nanosecond pulsed laser excitation at 532 nm. The effects of using an inhomogeneous field were compared to the use of a homogenous field and reported. It is shown that the spatial configuration can be used to alter the emission spectra of the system. The work is used to suggest a new configuration, referred to here as “reverse mode,” for liquid crystal-based random lasers. This new configuration may provide additional avenues for their use in commercial devices.1. INTRODUCTION
There is a continued interest in lasing in dye doped liquid crystals (DDLCs) based on prospects for building compact, all-organic, tunable mirrorless lasers, with potential applications ranging from miniature spectroscopic and medical tools to large area holographic laser displays. Broadly, DDLCs are categorized into (i) band edge cholesteric liquid crystal (CLC) lasers [1,2] and (ii) random lasers (RLs) [3,4], with significant scientific work on the mechanism of their operation presented in the literature [1–11]. In both cases, important aspects remain to be addressed before technological applications can be realized. For CLC lasing, a number of media and pulse widths have been observed [1,2,7]. They can provide low threshold, single mode lasing at specific wavelengths. They are ideally suited for seed lasing. Their use for high power emission is limited and is still under investigation. Conversely, for DDLC RLs, control of emission bandwidth and onset of lasing remain a challenge. In particular, random lasing in a variety of liquid crystal systems, including Polymer Dispersed Liquid Crystals and planar with both positive and negative Δε hosts, have been studied. Furthermore, observations on electrically controlled RL in dye doped nematic liquid crystals (NLCs) have been reported in the literature [10]. In all the previous work, application of the electric field is used to eliminate the laser action by decreasing the absorption and the spontaneous emitted fluorescence of the dye. These systems are referred to as “normal mode” since they are utilizing the liquid crystal operation in the most common manner. It is important to note that in many technological applications, it is more desirable to use external stimuli to induce laser action when needed. Therefore, in this paper, we present a configuration that can provide a “reverse mode” operation of guest-host-based RLs.
To achieve this, we use a liquid crystal host with negative dielectric anisotropy, doped with a positive dichroic laser dye, in a homeotropic aligned cell. Application of sufficient voltage () across the cell results in a field-induced planar configuration, with the liquid crystal + dye mixture molecules oriented parallel to the rubbing direction. However, due to inherent degeneracy in the system combined with low anchoring at the surfaces, the planar configuration will contain local nonuniformity in the liquid crystal orientation. This nonuniformity acts as scattering sites. A delicate balance is established between the field induced gain/loss mechanisms in our samples, which results in random lasing when pumped with a nanosecond excitation laser.
We have further explored the use of homogenous versus nonhomogenous fields on the lasing characteristics of the system. The experimental results suggest that the lasing characteristics (threshold, intensity, and wavelength) of the RLs can be modulated by the pattern of the applied field in addition to increasing the applied voltage and optimizing the dye concentration of the liquid crystal mixture.
Sign up for Photonics Research TOC. Get the latest issue of Photonics Research delivered right to you!Sign up now
2. SAMPLE PREPARATION AND EXPERIMENTAL SETUP
Our systems consist of a Host G NLC, Jiangsu Hecheng Chemical Material Company (stable between and 110°C, with birefringence of 0.15 and negative dielectric anisotropy of ), doped with 0.2, 0.5, and 1 wt. % of pyrromethene 597 dye (PM597, Exciton). At the doping level, the dyes were verified to be completely miscible.
The dyes exhibited dichroism in their absorption when viewed under polarized microscopy. To determine their order parameter, we measure their dichroism using polarization spectroscopy. A single cell with twin chambers was constructed using two glass substrates coated with a rubbed planar alignment layer. Glass spacers mixed with a UV-epoxy provided cell thicknesses . The cells were capillarity filled with pure host G, on one side of the cell, and with dye doped mixture (Host PM597) in the other side. Observing the samples under a polarized microscope showed an average planar alignment, with the optical axis situated in the plane of the cell, parallel to the rubbing direction, suggesting a positive dichroism by the dye. Figure 1(a) shows the physical samples used and the absorption spectra as a function of input polarization of light. The ratio between the absorption coefficients of the dye for the two orthogonal directions, the dichroic ratio (DR), was determined using polarized input light. The order parameter, , was determined from this, using a known relationship with the DR, , to be .
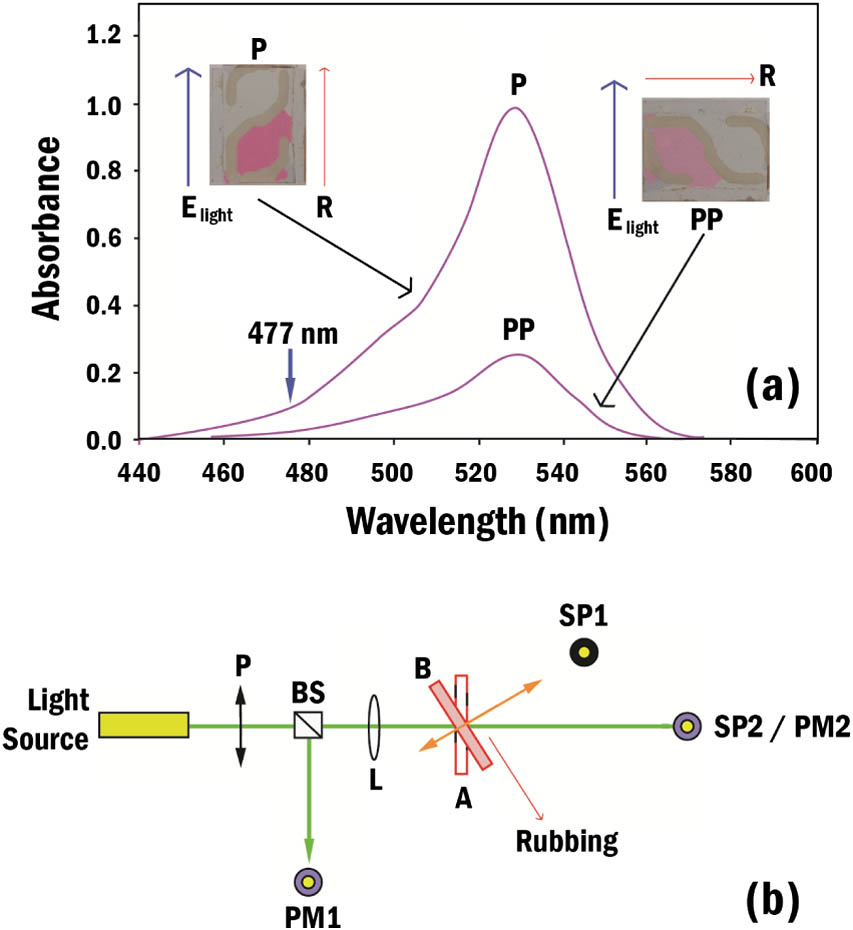
Figure 1.(a) Polarized absorption band of PM597 in Host G NLC. The twin planar liquid crystals cells are rubbed in the direction indicated with the arrow (, inset). The relative orientation of the sample with respect to the polarization of the incident light () has been identified as follows: , rubbing direction; , parallel to the incident electric field; and , rubbing direction perpendicular to the incident electric field. (b) Experimental setup. Configurations A and B are defined by the light source, the sample position. and the detector employed in each case, as described in the text. The linear polarizer (P), the beam splitter (BS), and the focusing lens (L) are common to all configurations.
The RL experiments were carried out in liquid crystal cells consisting of two parallel indium tin oxide (ITO) coated glass as substrate. A 2 mm diameter circle of ITO was etched in the middle of the substrate to allow for inhomogeneous field experiments. Each substrate was then coated with of polyimide layer Nissan SE-1211 (Nissan Chemical Industries), which induces a homeotropic alignment to the liquid crystal. The coating was performed using the spin-coating technique at 500 rpm for 10 s and then at 2000 rpm for 20 s. The substrates were prebaked at 100°C for 3 min, to evaporate solvents, and then baked at 190°C for 30 min to complete imidization, as prescribed by the manufacturer. The substrates were rubbed in an antiparallel configuration. This rubbing imparts a small pretilt of 1°–2° from vertical to the liquid crystal in the unenergized state. The anchoring and pretilt are not sufficient to impart a uniform direction upon application of voltage. The substrates were assembled into cells using 75 μm mylar as spacers and glued. The cells were capillary filled with the flow direction along the rubbing direction. The samples were observed under a polarized microscope and showed homeotropic alignment.
For the optical and spectroscopic characterization of our DDLC samples, different configurations of our basic experimental setup [Fig. 1(b)] were employed. For excitation source, three light source were used: (i) an Ocean Optics LS-1 tungsten halogen lamp (for the order parameter determination), (ii) an air cooled Ar CW laser, Ion Laser Technology model 5405 A (for the light transmission versus voltage experiments at 477 nm), and (iii) either a tunable pulsed Optical Parametric Oscillator Nd:YAG laser, Opolette 355II + UV (OPOTEK Inc.), with 5 ns pulse duration, or a frequency doubled coherent Nd:YAG laser, with 8 ns pulses at (for the RL experiments). In all the optical experiments, -polarization of the input light was used, that is, parallel to the plane of incidence. For detection, three systems were used: (i) an Ocean Optics HR2000 spectrometer (with spectral resolution) or a Jobin Yvon-Spex TRIAX 550 spectrometer fitted with an i-Spectrum ONE intensified CCD detector operated in the continuous mode for the RL experiments (SP1) and for the order parameter determination [SP2 detectors in Fig. 1(b)]; (ii) a Newport Research Power Meter model 815 used for the light transmission versus voltage experiments at 477 nm (PM2), and (iii) a Molectron Optimum 4001 energy meter or a RJ-7620 energy radiometer, Laser Precision (PM1 and PM2, respectively), used to measure the pulse input laser energy at 532 nm, in the RL experiments. In our experimental setup [Fig. 1(b)] the polarizer (P), the beam splitter (BS), and the focusing lens,(L; 20 cm focal length) yielded a beam waist at the sample of and are common in all the configurations of the experimental setup. The sample for random lasing was reoriented [to position B, Fig. 1(b)] for RL experiments to help with data acquisition.
3. RESULTS AND DISCUSSION
A. V<Vth State (Off State)
For the RL experiments, the homeotropic samples were set, in position B, with the rubbing direction parallel to the plane incidence. The light excitation with -polarization was incident at from normal to the cell. A multichannel CCD spectrometer with a fiber termination was used to capture the emission spectra [SP1, Fig. 1(b)], and the applied voltage was controlled with a power supply. Figure 2(a) shows the characteristic emission band observed from sample AMI-1 (Host PM597) under CW (black dotted line) and pulsed laser excitation (continuous red line) in the voltage off state (). At low excitation powers, the sample emission is characterized by a broad emission band with full width at half-maximum (FWHM) , and a maximum at . These observations are in good agreement with previous characterizations of the fluorescence associated with PM597 in liquid crystals [5] and is attributed to the spontaneous transition from the first excited state to the ground state . As the pump power is increased under pulsed laser excitation of the sample, the emission band narrows to an FWHM [Fig. 2(b)]. Due to ground state absorption, there is a redshift between the maximum, , of the narrow stimulated emission observed at , as compared with of the peak fluorescence emission of the samples at low input powers [Fig. 2(a)].

Figure 2.(a) Characteristic emission band observed from sample AMI-1 (Host PM597) under CW (black dotted line) and with pulsed () laser excitation (continuous red line) at 532 nm in the off state at . (b) FWHM and emission intensity (inset) versus pump energy for the ASE.
Previous reports in systems with PM597 laser dye dissolved in NLCs, with negative dielectric anisotropy, indicate that in cells with planar alignment, RL modes are the main characteristic of the emission spectra for pump energies above a certain threshold [11]. However, as shown in the data portrayed in Fig. 2, in the homeotropic liquid crystal cell configuration there is a predominantly linear enhancement of the output intensity, owing to preferential amplification at frequencies close to the maximum of the gain spectrum. In other words, at these pump levels, and with no applied voltage (), no clear threshold, coherent directional emission, or laser modes are observed or present in the emission of our samples. These observations constitute an important difference with respect the data reported in the literature [11] and are due to a poor balance between gain/loss ratio in the off state of our AMI-1 systems. This situation remains unchanged for voltages below .
B. V>Vth (On State)
1. Homogeneous Electric Field
In this section, we explore the application of a homogenous electric field across the cell. As the applied voltage increases above the threshold voltage for Fréedericksz transition, the liquid crystals reorient in response to the field [Figs. 3(a)–3(c)].
Figure 3.Light transmission of sample AMI-1 between crossed polarizers (a) at , (b) after 1 min at , and (c) after 20 min at . (d) Absorbance (at ) versus voltage. (e) Emission spectra and light intensity at 578 nm (inset) versus voltage. The results presented in (d) and (e) correspond to experiments that were performed in our samples after 20 min at the applied voltage indicated in the figure.
In liquid crystals with negative dielectric anisotropy (), as in the case at hand, the molecules undergo elastic deformation to align perpendicular to the applied field direction and to minimize the Gibbs free energy of the system. This deformation is characterized by the “tilt angle,” , of the director measured relative to the plane of the glass substrates. In our case, the initial value of in the off state will deviate once . This can be visually observed between cross polarizers, as shown in Fig. 3. At voltages below , the liquid crystal orientation has little effect on normally incident light polarization, and as such, little light leakage occurs in cross polarization geometry [Fig. 3(a)].
At ( voltage), the tilt angle of NLC molecules is larger near the substrates and has a minimum at the center of the cell, where the liquid crystal mixture has the tendency to be oriented parallel to the plane of the glass substrates (absorptive mode). This molecular reorientation induces a phase retardation Δγ and allows some of the incident light to traverse the second polarizer. In switching the cell to the on state, topological defects will also appear as a consequence of going from homeotropic to homogeneous symmetry. The relaxation time , depends on the applied electric field, the specific characteristics of the host, and the geometry of the cell. In our cells, the relaxation time of the defects induced by the electric field was observed to be , when the voltage was in the range [Figs. 3(b) and 3(c)]. Therefore all our observations of the effects of the electric field on the optical properties of our samples were always investigated at . At , the reoriented molecules (NLC + PM597) are responsible for enhancing the light absorbance within the absorption band of the laser dye [Fig. 3(d)].
The effects of the electric field on the optical response and spectroscopic characteristics of the emission spectra of our sample AMI-1 were analyzed at different voltages. Figure 3(e) shows the emission spectra of sample AMI-1, under constant input laser excitation of at 532 nm, as a function of the applied voltage. At low voltage (), the emission spectra show the same narrow emission band of the PM597 dye previously observed in the off state of our samples [Fig. 2(a)]. Upon increasing the applied voltage (at constant input power laser excitation), a slight blueshift in the peak emission was observed, similar to the one reported for the amplified spontaneous emission (ASE) in NLCs doped with pyrromethene dyes [12]. At , discrete sharp peaks emerge at the blue tail of the emission band, and a bright and directional orange spot (typical of RL systems) appears on the background screen. The intensity of these sharp peaks changes as a function of the applied voltage [Fig. 3(e)]. From the data portrayed in this figure a small redshift () is observed in the wavelength of the maximum peak emissions ( and 578 nm at and 16 V, respectively) while their line width () do not alter. The location and width of the emission are in good agreement with previous reports of the random lasing in planar liquid crystal cells that are filled with mixtures of NLCs with negative dielectric anisotropy and PM597 laser dye [11]. All these results, combined with data reported in the literature [11], suggest that the discrete spectral modes shown in Fig. 3(e) result from spatial resonances in the liquid crystal mixture, and that such resonances are related to the texture of the liquid crystal mixture AMI-1 in the on state at different AC voltage. As in previous reports, the basic mechanism for RL is coherent backscattering [3,11,13–17], expected to be strongly influenced by gain. The inset in Fig. 3(e) shows the results, at a constant applied voltage of , of the variation of the peak intensity at 578 nm (RL) as a function of the input laser energy. Along with a nonlinear increase with increasing the pumped energy, the presence of a clear energy threshold () confirm the presence of random lasing emission. The lasing threshold value estimated from Fig. 3(e) for the onset of the RL emission in our sample AMI-1 is higher than the one reported in the literature for planar liquid crystal cells filled with a similar mixture of an NLC with , and 0.5 wt. % PM597 [11]. It is interesting to note that the sample shows ASE in addition to the modes, which indicates that the system is not optimized for best gain/loss ratio.
To better optimize the system, the effect of the dye concentration on the RL characteristics of our liquid crystal mixtures was investigated. Two additional samples with lower and higher wt. % of PM597 in Host G were prepared, namely AMI-2 and AMI-3. The emission spectra of AMI-2 (Host PM597) at follows a similar trend (line narrowing and linear increase of the ASE as a function of the input energy) as the one observed before for sample AMI-1 (Fig. 2). However, as opposed to the previous concentration, the conversion in AMI-2 occurs at , as is shown in Fig. 4(a) (continuous red line). Furthermore, ASE is absent in the emission () of AM-2 in the on state.
Figure 4.(a) Emission spectra of the sample AMI-2 under pulsed laser of at 0 V (pink line) and 4 V (red line). (b) RL threshold versus voltage in sample AMI-2, and lasing threshold versus the dye concentration in samples AMI-1, AMI-2, and AMI-3 (inset) at .
For comparison, Fig. 4(a) shows the off and on emission spectra of sample AMI-2, under a constant laser excitation of , at 532 nm. In the case, the field induced absorption of the dye improves the gain/loss ratio in sample AMI-2, and a reduction of the lasing threshold was observed. This reduction increases as a function of the applied electric field [Fig. 4(b)].
At higher dye concentrations, evidence of electrically controlled RL in sample AMI-3 (Host PM597) was also observed. For the sample AMI-3 in the case, ASE emission was detected, while in the case the optical response of the sample as a function of the input power showed characteristics similar to the sample AMI-1 [Fig. 3(e)]. Looking at the effect of the applied electric field on the lasing characteristics of the samples AMI-1, AMI-2, and AMI-3 under the experimental conditions presented here we observed that, in general, (i) RL emission occurs only after ; (ii) the RL threshold decreases as a function of the applied electric field, and (iii) at fixed voltage, the RL threshold increases with the dye concentration in our samples (Fig. 4, inset). These results are consistent with the basic mechanism for RL generation. It is well known that the important parameter which affects the lasing threshold is the transport mean free path, , defined as the distance a photon travels before its direction is randomized [16,17]. The light-scattering cross sections, which originate from local director fluctuations [18], depend on the relative orientation between the light polarization and the liquid crystal director. As a result, the magnitude of can be controlled directly by the amplitude of the applied electric field as the sample passes through different scattering states. The RL is the result of the weak localization of the fluorescent photons due to the random multiscattering and gain in an active medium [4,10,11,13–17]. To the best of our knowledge, all these results represent the first report of electrically controlled off RL based on a liquid crystal host material with negative dielectric anisotropy.
2. Inhomogeneous Electric Field
In the previous experiments, the applied electric field had little spatial variation. On the other hand, the reorientation effect of nematic molecules in an inhomogeneous electric field is expected to create additional features by presenting a two dimensional reorientation of liquid crystal and dye molecules.
To study this effect, we used the etched substrates described above to create a radially varying electric field in the cell. This configuration has been used extensively by groups interested in liquid crystal lensing [19,20]. In this configuration, the etching creates a fringing field in the cell that is used to impart a phase, , to propagating light. To produce this modulation in with a liquid crystal layer of uniform thickness, it is essential to design an electrode system capable of creating an axially symmetric and spatially inhomogeneous electric field. The desired electric field distribution can be formed, in its simplest approach, by using electrodes in the glass liquid crystal cells, with circular holes [Figs. 5(a) and 5(b)]. This configuration has been extensively studied for microlens arrays [21].
Figure 5.Crossed polarizers transmission observed in sample AMI-4 at (a) and (b) . (c) Phase-lag profile at . (d) Emission spectra (, 8 ns pulse width, and ) in the off state (black) and in the on state at (R1, pink dotted line; R2, red continuous line). A black mask was employed [(d), inset], to ensure the input laser excitation on region R2.
Our hole pattern liquid crystal cells were designed to have, on the electrode of one of the substrates, an etched (no ITO) circle with a diameter of 2 mm. The second substrate had an electrode that was continuous (no etching). As in the previous cases (samples AMI-1–3), both substrates were then coated with a homeotropic alignment layer (polyimide 1211) everywhere, rubbed and filled with a mixture of Host G NLC doped with PM597 laser dye (0.2 wt. %, sample AMI-4). The cell thickness was kept at 75 μm.
Two regions, R1 and R2, may be identified in our hole pattern liquid crystal cells. The region R1 corresponds to the volume of the cell where the applied electric field is perpendicular to the plane of the glass substrates (homogeneous electric field region), and the hole region R2 to the volume where the fringing field is stronger at the edge of the opening and decreases gradually from the edge to the center of the hole area [Figs. 5(a) and 5(b)].
Since the LC possesses negative dielectric anisotropy, the nematic molecules tend to reorient depending on the field strength. As a result, a radially symmetric refractive index distribution is formed as the voltage is gradually increased. Inside of R2 [Fig. 5(b)], the radial reorientation of the liquid crystal molecules is appreciable, and a number of interference rings are observed in the microscope with crossed polarizers at . In Figs. 5(b) and 5(c), the center of R2 looks dark, and the phase profile () has a plateau, due to the homeotropic alignment of the molecules in the liquid crystal mixture [21].
The emission spectrum of the sample AMI-4 under pulsed laser excitation at 532 nm shows that in the regime, the only observed emission is the characteristic ASE [Fig. 5(d), black dotted line]. The absorption of the dye molecules and the gain in the system has a minimum in this configuration and hence only ASE (5 nm FWHM) was detected, peaking at 587 nm. This is expected since in the absence of a field, the two systems (homogenous, R1, and inhomogenous, R2) are identical. However, in the state of the sample AMI-4 at , the RL emission from R2 was observed to have significantly different spectral characteristics compared to the homogenous field region (R1) at constant input power [Fig. 5(d)]. When a voltage of 16 V is applied to the cell, the LC molecules in R1 are expected to be planar, similar to the sample AMI-2. And as expected, the lasing characteristics of this region are similar to those of the sample AMI-2 (on state) and show various random lasing modes, with the maximum lasing intensity at 572 nm. In Fig. 5(d) (inset), the green light corresponds to the transmitted pump beam at 532 nm, and the yellow light is associated with the RL signal. The output RL emission is highly directional, and the detector needs to be placed perpendicular to the liquid crystal cell to obtain the signal. The RL emission coming out from the hole region R2 presents, on the other hand, a distinct redshift in the wavelength. This difference is the result of the difference between scattering efficiency associated with the different liquid crystal orientations in these two regions of the cell [Fig. 5(d), continuous red line]. As mentioned before, diffusive lasing occurs in dye doped nematics by recurrent light scattering, and the lasing frequencies are determined by the phase relationship between counterpropagating scattered light waves [3,11]. In general, the maximum of the RL emission is determined by interference effects that introduce coherence and feedback, leading to lasing action [3,11]. The redshift observed in the laser emission from region R2, compared with the one coming out from region R1, may broadly be attributed to differences in the interference effects occurring in these two regions. Currently, experiments are being conducted in our laboratory in order to investigate this phenomenon and if possible use it as a means of wavelength selectivity in an RL system.
4. CONCLUSIONS
We observed and characterized a new configuration for electrically controlled RL action. We studied the effect in uniform and hole pattern liquid crystal cells filled with a new dye–NLC composite. Experimental results show that the amplitude of externally applied voltage and dye concentration can control the lasing intensities of the generated RLs and their energy thresholds. Light phase modulation induced by inhomogeneous electric fields resulted in a redshift of the RL emission observed in our hole pattern liquid crystal cells.
ACKNOWLEDGMENT
Acknowledgment. This research was supported in part by CONACyT, Mexico. The authors will like to thank Prof. P. Palffy-Muhoray for making the facilities of his laboratory at the LCI available and ArteHiga for the assistance in the art of the figures.
References
[1] I. P. Ilchishin, E. A. Tikhonov, V. G. Tischenko, M. T. Shpak. Generation of tunable radiation by impurity cholesteric liquid crystals. J. Exp. Theor. Phys. Lett., 32, 27-30(1981).
[2] V. I. Kopp, B. Fan, H. K. M. Vithana, A. Z. Genack. Low-threshold lasing at the edge of a photonic stop band in cholesteric liquid crystals. Opt. Lett., 23, 1707-1709(1998).
[3] G. Strangi, S. Ferjani, V. Barna, A. De Luca, C. Versace, N. Scaramuzza, R. Bartolino. Random lasing and weak localization of light in dye-doped nematic liquid crystals. Opt. Express, 14, 7737-7744(2006).
[4] P. Palffy-Muhoray, W. Cao, M. Moreira, B. Taheri, A. Munoz. Photonics and lasing in liquid crystal materials. Phil. Trans. R. Soc. A, 364, 2747-2761(2006).
[5] C. Mowatt, S. M. Morris, M. H. Song, T. D. Wilkinson, R. H. Friend, H. J. Coles. Comparison of the performance of photonic band edge liquid crystal lasers using different dyes as the gain medium. J. Appl. Phys., 107, 043101(2010).
[6] H. Coles, S. Morris. Liquid crystal lasers. Nat. Photonics, 4, 676-685(2010).
[7] A. Muñoz, M. E. McConney, T. Kosa, P. Luchette, L. Sukhomlinova, T. J. White, T. J. Bunning, B. Taheri. Continuous wave mirrorless lasing in cholesteric liquid crystals with a pitch gradient across the cell gap. Opt. Lett., 37, 2904-2906(2012).
[8] Y. A. Nastishin, T. H. Dudok. Optically pumped mirrorless lasing. a review. Part I. random lasing. Ukr. J. Phys. Opt., 14, 146-170(2013).
[9] D. Wenzlik, A. Varanytsia, A. Munoz, T. Kosa, B. Taheri, R. Zentel, P. Palffy-Muhoray. Distributed feedback lasing in cellulose films. Opt. Mater. Express, 4, 162-171(2014).
[10] C.-R. Lee, J.-D. Lin, B.-Y. Huang, S.-H. Lin, T.-S. Mo, S.-Y. Huang, C.-T. Kuo, H.-C. Yeh. Electrically controllable liquid crystal random lasers below the Fréedericksz transition threshold. Opt. Express, 19, 2391-2400(2011).
[11] V. Barna, V. I. Vlad, A. Petris, I. Dancus, T. Bazaru, E. S. Barna, A. de Luca, S. Ferjani, G. Strangi. Efficient random laser effect in a new dye–nematic liquid crystalline composite. Romanian Rep. Phys., 62, 444-454(2010).
[12] R. Fan, Y. Jiang, Y. Xia, D. Chen. Widely tunable amplified spontaneous emission of pyrromethene 650-doped nematic liquid crystal. J. Russ. Laser Res., 32, 139-143(2011).
[13] A. Y. Zwzin. Weak localization in backscattering from an amplifying medium. Europhys. Lett., 26, 517-520(1994).
[14] H. Stark, M. H. Kao, K. A. Jester, T. C. Lubensky, A. G. Yodh, P. J. Collings. Light diffusion and diffusing-wave spectroscopy in nematic liquid crystals. J. Opt. Soc. Am. A, 14, 156-178(1997).
[15] H. K. M. Vithana, L. Asfaw, D. L. Johnson. Coherent backscattering of light in a nematic liquid crystal. Phys. Rev. Lett., 70, 3561-3564(1993).
[16] H. Cao. Review on latest developments in random lasers with coherent feedback. J. Phys. A, 38, 10497-10535(2005).
[17] F. Carbone, A. De Luca, V. Barna, S. Ferjani, C. Vena, C. Versace, G. Strangi. Coherent back scattering and dynamical light localization in liquid crystals driven throughout chaotic regimes. Opt. Express, 17, 13435-13440(2009).
[18] P. G. de Gennes. The Physics of Liquid Crystals(1974).
[19] M. Ye, S. Sato. Optical properties of liquid crystal lens of any size. Jpn. J. Appl. Phys., 41, L571-L573(2002).
[20] M. Ye, B. Wang, S. Sato. Liquid crystal lens with focus movable in focal plane. Opt. Commun., 259, 710-722(2006).
[21] A. Y. Gvozdarev, G. E. Nevskaya, I. B. Yudin. Adjustable liquid-crystal microlenses with homeotropic orientation. J. Opt. Technol., 68, 682-686(2001).

