
Zijie Wang, Xiaobei Zhang, Qi Zhang, Yiqi Chen, Yong Yang, Yang Yu, Yang Wang, Yanhua Dong, Yi Huang, Tingyun Wang, "Monitoring and identifying pendant droplets in microbottle resonators," Photonics Res. 10, 662 (2022)
- Photonics Research
- Vol. 10, Issue 3, 662 (2022)
Abstract
1. INTRODUCTION
Manipulating microvolume droplet and characterizing droplet properties are of great importance in life science and biological applications, e.g., drug discovery, particle sorting, droplet generation [1–3]. Droplet properties have been extensively investigated in the past years, including effective surface tension and viscosity, dynamic evaporation, and droplet oscillation, etc. [4–6]. Specifically, a droplet can function as a resonator to excite the whispering gallery mode (WGM), owing to its smooth surface and spherical morphology [7–9]. It provides an excellent platform to investigate optomechanics, by virtue of the characteristic of being hundreds of times softer than solid resonators [10]. Accordingly, the deformation of droplets driven by photon pressure can be determined [10,11]. Actually, the above-mentioned investigations rely on auxiliary devices to sustain the morphology of droplets, such as solid substrates and optical fiber end face and stem [10–12]. In addition, the specific technologies and high-speed cameras are necessary to manipulate droplet position and capture motion images [13,14].
Optofluidic capillary is a promising candidate to characterize the fluid properties due to the inherently fluidic channel [15,16]. Recently, WGMs in a microcapillary-based droplet resonator have been demonstrated to measure droplet morphologic variation with nanoscale precision [17]. Compared with a microcapillary, an optofluidic microbottle resonator (OFMBR) can enhance light–matter interaction, thanks to well-confined WGMs [18–20]. It has attracted enormous attention in microfluidic application, including gas and gas concentration identification [21,22], magnetic field intensity and bimolecular binding event monitoring [23–25], and ultrasound and nanoparticle detection [26–29]. Furthermore, monitoring of dynamic flow rates and the phase transition of hydrogel are demonstrated [30–33]. However, there are few demonstrations, to the best of our knowledge, in which OFMBR is employed to characterize liquid properties and identify liquid types.
Herein, monitoring liquid mass and radius in real time and identifying liquid types in OFMBR are demonstrated by observing resonance wavelength variation. Thanks to liquid surface tension and solid–liquid interfacial forces, liquid outflowing from an OFMBR end face forms a pendant droplet along its stem. The growing droplet gravity decreases the coupling gap and introduces compressive force between the tapered fiber and OFMBR, which shifts the resonance wavelength. Theoretically, the displacement on OFMBR caused by droplet gravity is simulated using COMSOL simulation software, which is based on solving a Navier equation. Liquid mass and liquid identification experiments are carried out, and the morphology of a pendant droplet is monitored by a CCD camera. Our scheme paves the way for applications of droplet generation and liquid properties characterization.
Sign up for Photonics Research TOC. Get the latest issue of Photonics Research delivered right to you!Sign up now
2. OPERATION PRINCIPLE AND THEORETICAL ANALYSIS
The schematic diagram of the proposed sensor is shown in Fig. 1(a), which utilizes a tapered fiber perpendicularly coupling with a horizontally placed OFMBR. One end of the OFMBR connects to a commercial syringe pump to inject fluid with controllable and stable flow rates. The other flat end face is kept open to serve as a pendant droplet generator. The liquid outflowing from the OFMBR end face forms a pendant droplet along its stem thanks to the liquid surface tension and solid–liquid interfacial forces. Further, the pendant droplet will detach from the stem when the growing droplet gravity is greater than the liquid surface tension.
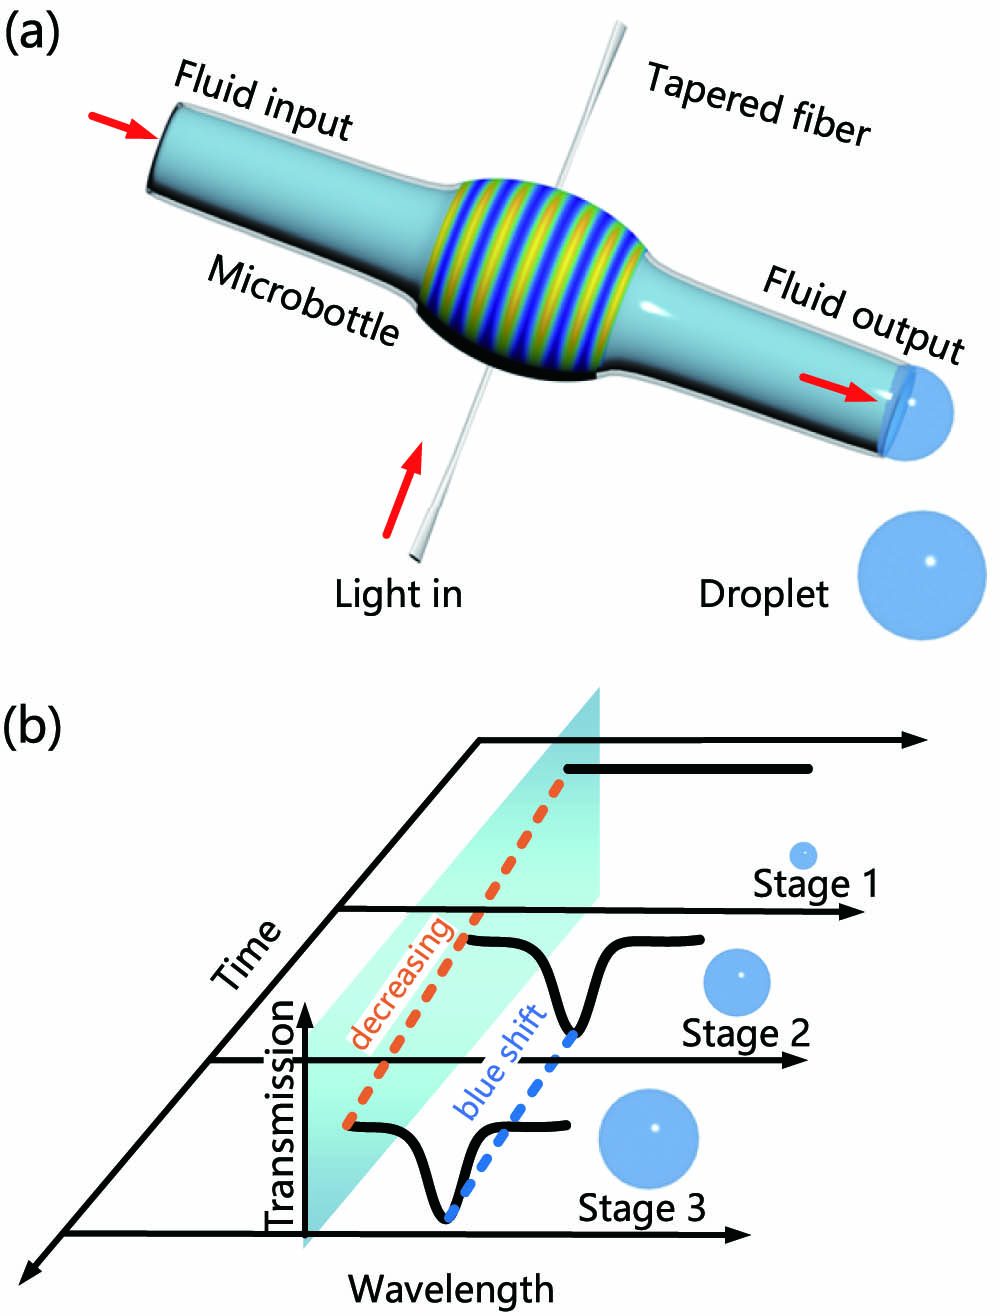
Figure 1.(a) Schematic diagram of the proposed sensor. (b) Spectrum changes under three stages. Blue and orange dashed lines represent variations of the resonance wavelength and signal intensity with time, respectively.
The schematic of spectrum variations during pendant droplet formation, as illustrated in Fig. 1(b), can be clarified in three stages. In the first stage, the coupling gap between the OFMBR and tapered fiber maintains beyond the coupling region. In consequence, the WGM will not be excited, presenting a flat transmission spectrum. After that, the liquid outflowing from the OFMBR end face starts to form a pendant droplet along its stem. In the second stage, the growing gravity of the pendant droplet decreases the coupling gap, prompting to excite the WGM. In the third stage, the persistently growing gravity results in the physical contact and compressive force between tapered fiber and OFMBR. The compressive force then introduces a decreased radius of OFMBR, resulting in a blueshift of the resonance wavelength with a decreasing signal intensity. The maximum wavelength shift can be obtained when the droplet gravity is equal to liquid surface tension. Subsequently, the pendant droplet detaches from the stem, a new pendant droplet forms, and the above-mentioned stages repeat simultaneously.
The mass of the pendant droplet can be calculated by multiplying the fluid density by the fluid volume. The radius of the pendant droplet can be deduced according to the sphere volume formula, providing that the morphology of the pendant droplet is approximated as a sphere under microgravity [5,11]. Consequently, the mass and radius of the pendant droplet can be obtained from
The operation principle of the proposed sensor is that the gravity of pendant droplet would alter both the refractive index and radius of OFMBR by mechanical and strain effect, respectively. Both variations prompt the resonance wavelength to shift, which can be expressed as
In order to analyze the influence of droplet gravity on device displacement, the solid mechanics interface of COMSOL Multiphysics is employed. As shown in the inset on the top right of Fig. 2, the simulation model is established, and three boundary conditions are considered: 1) one end of OFMBR and both ends of the tapered fiber are set as fixed ends, where no displacement occurs; 2) a contact pair is established between the OFMBR and tapered fiber; 3) a point load is added at the other end face of OFMBR to simulate the droplet gravity. The terms
![]()
Figure 2.(a) Simulation result of displacement under droplet gravity when the length
Figure 2(a) shows the simulation result as
3. EXPERIMENT RESULTS
The OFMBR used in the experiment has a maximum outer diameter of 200 μm and a wall thickness of around 8 μm, which is fabricated by discharging a silica capillary with an inner and outer diameter of 75 and 125 μm (Polymicro, TSP075150), respectively. The microscope image of OFMBR is shown in the dashed box in Fig. 3. The WGMs of OFMBR are evanescently excited by an adiabatic tapered fiber with a diameter of 1 to 2 μm, which is fabricated by a heat-and-pull method and encapsulated in a U-shaped groove to enhance the tapered fiber robustness.
![]()
Figure 3.Schematic diagram of liquid mass and liquid identification sensing system. Inset in the dashed box shows the microscopic image of the OFMBR. TSL, tunable semiconductor laser; CCD, charge coupled device; PD, photodetector; PC, polarization controller.
Figure 3 shows the setup for sensing experiments. The light emitted from a tunable semiconductor laser (Santec, TSL-710) at the 1540 nm wavelength band transmits into tapered fiber through a polarization controller (PC) to excite the WGMs of OFMBR. The output light is composed of light propagating directly from tapered fiber and coupling back from the OFMBR, which will be detected by an oscilloscope after a photodetector (PD). The coupling position between the tapered fiber and OFMBR is adjusted by two 3D translation stages via a CCD-assisted
In the experiment, we first verify the proposed sensor works with periodicity. We choose a phosphate buffer solution (PBS) with a density of
![]()
Figure 4.(a) Resonance wavelength of two pendant droplet changes with flow time as the flow rate of the syringe pump is set as 20 μL/min. (b) Dependence of resonance wavelength shifts on flow time. Dots in the figure represent experiment data; the lines are fitting lines.
In the mass sensing experiment, the PBS is infused into the OFMBR with the stable flow rates of 10 and 30 μL/min. The procedure for the sensing experiment is the same as above, with the obtained results shown in Fig. 5. The detached times of a pendant droplet under 10 and 30 μL/min are around 50 s and 17 s. Accordingly, the maximum pendant droplet mass and radii under two flow rates are 8.77 mg and 1.28 mm, 8.99 mg and 1.29 mm, respectively. The little difference in maximum pendant droplet mass could arise from the difference in formation rates and low time recording accuracy. The resonance wavelength dependence on pendant droplet mass is shown in Figs. 5(a) and 5(b). The obtained sensitivities are
![]()
Figure 5.Resonance wavelength dependence and radius of pendant droplet dependence on droplet mass as the flow rates are (a) 10 μL/min and (b) 30 μL/min.
The proposed structure is also capable of identifying liquids with different surface tension coefficients. The principle is that the larger the surface tension coefficient, the greater the maximum pendant droplet gravity, thus inducing a larger maximum wavelength shift. Distilled water and alcohol are chosen as the detected liquids here owing to their distinguished surface tension coefficients (
![]()
Figure 6.(a) Detached time for distilled water and alcohol at different flow rates. (b) Dependence of wavelength shift on flow time for distilled water and alcohol.
In the liquid identifying experiment, two types of liquids are infused into an individual injection syringe. Then, distilled water passes through the OFMBR with a stable flow rate of 10 μL/min, and a spectrum is recorded as the pendant droplet evolves. Subsequently, the experiment is repeated by employing the other injection syringes filled with alcohol. The wavelength shift dependence on flow time for both liquids is shown in Fig. 6(b), which reveals that the maximum wavelength shifts caused by alcohol and distilled water are
To observe the morphology of pendant droplets with a micrometer to millimeter scale radius, a CCD camera is employed to monitor the pendant droplet formation. The morphologies of the distilled water pendant droplet as time evolves are shown on the right side of Fig. 7, which present a sphere under microgravity, and a slight deformation occurs as the radius increases to millimeter-scale [5]. Furthermore, the radius of the pendant droplets can be deduced by converting the measured pixel length to the actual value. Figure 7 shows the comparison of pendant droplet radius between experimental and theoretical values, which are calculated based on Eq. (1). The experimental results are in agreement with the theoretical ones, where the little difference can be ascribed to the liquid evaporation [17] and limited pixel and resolution of the CCD camera.
![]()
Figure 7.Comparison of pendant droplet radius between experiment (red dots) and theoretical (blue dots) values. Right side shows images of pendant droplet of distilled water at different moments.
4. CONCLUSION
We have proposed and demonstrated a liquid mass and liquid type identification sensor, utilizing a tapered fiber and an OFMBR. Theoretically, the influence of droplet gravity on device displacement is analyzed using COMSOL simulation software. It reveals that droplet gravity contributes to altering the coupling states between tapered fiber and OFMBR, which shifts the resonance wavelength. Experimentally, we first verify that the proposed sensor works with periodicity; then, the liquid mass sensing experiment is carried out. The maximum sensitivity of
References
[1] P. J. Galley, G. M. Hieftje. Technique for producing capillaries with reproducible orifice diameters for uniform droplet generation. Appl. Spectrosc., 46, 1460-1463(1992).
[2] Y. C. Tan, J. S. Fisher, A. I. Lee, V. Cristini, A. P. Lee. Design of microfluidic channel geometries for the control of droplet volume, chemical concentration, and sorting. Lab Chip, 4, 292-298(2004).
[3] S. Daniel, M. K. Chaudhury, J. C. Chen. Fast drop movements resulting from the phase change on a gradient surface. Science, 291, 633-636(2001).
[4] E. Preter, R. A. Katims, V. Artel, C. N. Sukenik, D. Donlagic, A. Zadok. Monitoring and analysis of pendant droplets evaporation using bare and monolayer-coated optical fiber facets. Opt. Mater. Express, 4, 903-915(2014).
[5] Q. M. Lv, Y. C. Wu, C. Li, X. C. Wu, L. H. Chen, K. F. Cen. Surface tension and viscosity measurement of oscillating droplet using rainbow refractometry. Opt. Lett., 45, 6687-6690(2020).
[6] X. G. Li, R. X. Wang, H. X. Shi, B. H. Song. Effective surface tension of liquid marbles using controllable nanoparticle monolayers. Appl. Phys. Lett., 113, 101602(2018).
[7] A. Giorgini, S. Avino, P. Malara, P. D. Natale, G. Gagliardi. Opto-mechanical oscillator in a nanoliter droplet. Opt. Lett., 43, 3473-3477(2018).
[8] R. Lee, P. Zhang, Y. Xu, S. Jung. Radiation pressure-induced nonlinearity in a micro-droplet. Opt. Express, 28, 12675-12682(2020).
[9] S. Maayani, T. Carmon. Droplet Raman laser coupled to a standard fiber. Photon. Res., 7, 1188-1192(2019).
[10] D. D. Ambrosio, M. Capezzuto, S. Avino, P. Malara, A. Giorgini, P. D. Natale, G. Gagliardi. Light pressure in droplet micro-resonators excited by free-space scattering. Opt. Lett., 46, 3111-3114(2021).
[11] S. Maayani, L. L. Martin, S. Kaminski, T. Carmom. Cavity optocapillaries. Optica, 3, 552-555(2015).
[12] A. Jonas, Y. Karadag, M. Mestre, A. Kiraz. Probing of ultrahigh optical Q-factors of individual liquid microdroplets on superhydrophobic surfaces using tapered optical fiber waveguides. J. Opt. Soc. Am. B, 29, 3240-3247(2012).
[13] M. Ivanov, K. Chang, I. Galinskiy, B. Mehlig, D. Hanstorp. Optical manipulation for studies of collisional dynamics of micron-sized droplets under gravity. Opt. Express, 25, 1391-1404(2017).
[14] S. Kaminske, L. L. Martin, T. Carmom. Tweezers controlled resonator. Opt. Express, 23, 28914-28919(2015).
[15] S. Zhu, Y. Liu, L. Shi, X. Xu, X. Zhang. Extinction ratio and resonant wavelength tuning using three dimensions of silica microresonators. Photon. Res., 4, 191-196(2016).
[16] H. Wan, J. Chen, C. Wan, Q. Zhou, J. Wang, Z. Zhang. Optofluidic microcapillary biosensor for label-free, low glucose concentration detection. Biomed. Opt. Express, 10, 3929-3937(2019).
[17] T. Hamidfar, K. V. Tokmakov, B. J. Mangan, R. S. Windeler, A. V. Dmitriev, D. L. P. Vitullo, P. Bianucci, M. Sumetsky. Localization of light in an optical microcapillary introduced by a droplet. Optica, 5, 382-388(2018).
[18] K. Han, J. H. Kim, G. Bahl. High-throughput sensing of freely flowing particles with optomechanofluidics. Optica, 3, 585-591(2016).
[19] F. Xie, N. Yao, W. Fang, H. Wang, F. Gu, S. Zhuang. Single-mode lasing via loss engineering in fiber-taper-coupled polymer bottle microresonators. Photon. Res., 5, B29-B33(2017).
[20] Y. Louyer, D. Mechede, A. Rauschenbeutel. Tunable whispering gallery mode resonators for cavity quantum electrodynamics. Phys. Rev. A, 72, 2409-2413(2005).
[21] H. Y. Li, B. Sun, Y. G. Yuan, J. Yang. Guanidine derivative polymer coated microbubble resonator for high sensitivity detection of CO2 gas concentration. Opt. Express, 27, 1991-2000(2019).
[22] Z. D. Peng, C. Q. Yu, H. L. Ren, C. L. Zou, G. C. Guo, C. H. Dong. Gas identification in high-
[23] F. Y. Hou, X. B. Zhang, L. Yang, W. Sun, Y. Yang, Y. H. Dong, Y. Huang, T. Y. Wang. Magnetic fluid infiltrated microbottle resonator sensor with axial confined mode. IEEE Photon. J., 12, 6802709(2020).
[24] L. Hao, X. D. Fan. Characterization of sensing capability of optofluidic ring resonator biosensors. Appl. Phys. Lett., 97, 011105(2010).
[25] Z. H. Guo, Q. J. Liu, C. G. Zhu, B. W. Wang, Y. Zhou, X. Wu. Ultra-sensitive biomolecular detection by external referencing optofluidic microbubble resonators. Opt. Express, 27, 12424-12435(2019).
[26] J. S. Pan, B. Zhang, Z. Y. Liu, J. X. Zhao, Y. H. Feng, L. Wan, Z. H. Li. Microbubble resonators combined with digital optical frequency comb for high-precision air-coupled ultrasound detectors. Photon. Res., 8, 303-310(2020).
[27] J. M. Ward, Y. Yang, F. C. Lei, X. C. Yu, Y. F. Xiao, S. N. Chormaic. Nanoparticle sensing beyond evanescent field interaction with a quasi-droplet microcavity. Optica, 5, 674-677(2018).
[28] W. Chen, J. Zhang, B. Peng, Ş. K. Özdemir, X. Fan, L. Yang. Parity-time-symmetric whispering-gallery mode nanoparticle sensor. Photon. Res., 6, A23-A30(2018).
[29] D. Q. Yang, F. Gao, Q. T. Cao, C. Wang, Y. F. Ji, Y. F. Xiao. Single nanoparticle trapping based on on-chip nanoslotted nanobeam cavities. Photon. Res., 6, 99-108(2018).
[30] D. Q. Yang, A. Q. Wang, J. H. Chen, X. C. Yu, C. W. Lan, Y. F. Ji, Y. F. Xiao. Real-time monitoring of hydrogel phase transition in an ultrahigh
[31] D. Q. Yang, J. H. Chen, Q. T. Cao, B. Duan, H. J. Chen, X. C. Yu, Y. F. Xiao. Operando monitoring transition dynamics of responsive polymer using optofluidic microcavities. Light Sci. Appl., 10, 128(2021).
[32] Z. J. Wang, X. B. Zhang, S. C. Zhao, Y. Yu, H. Sun, Y. Yang, Y. H. Dong, Y. Huang, T. Y. Wang. High sensitivity flow rate sensor enabled by higher order modes of packaged microbottle resonator. IEEE Photon. Technol. Lett., 33, 599-603(2021).
[33] Z. M. Chen, Z. H. Guo, X. Mu, Q. Li, X. Wu, H. Y. Fu. Packaged microbubble resonator optofluidic flow rate sensor based on Bernoulli Effect. Opt. Express, 27, 36932-36940(2019).
[34] T. Loppolo, U. K. Ayaz, M. V. Otugen. High-resolution force sensor based on morphology dependent optical resonances of polymeric spheres. J. Appl. Phys., 105, 013535(2009).
[35] L. E. Malvern. Introduction to the Mechanics of a Continuous Medium(1969).
[36] M. E. Gurtin. The Linear Theory of Elasticity(1973).
[37] B. T. Cao. Solutions of Navier equations and their representation structure. Adv. Appl. Math., 43, 331-374(2009).
[38] J. M. Ward, Y. Yang, S. N. Chormaic. Glass-on-glass fabrication of bottle-shaped tunable microlasers and their applications. Sci. Rep., 6, 25152(2015).


Set citation alerts for the article
Please enter your email address

© Copyright 2018-2021 | Chinese Laser Press. All Rights Reserved 沪ICP备15018463号-20