
Azeddine Tellal, Omar Ziane, Patrice L. Baldeck. Diffraction-limited microfocusing generated by polymer microlines separated by 1.12 μm[J]. Chinese Optics Letters, 2019, 17(8): 082201
- Chinese Optics Letters
- Vol. 17, Issue 8, 082201 (2019)
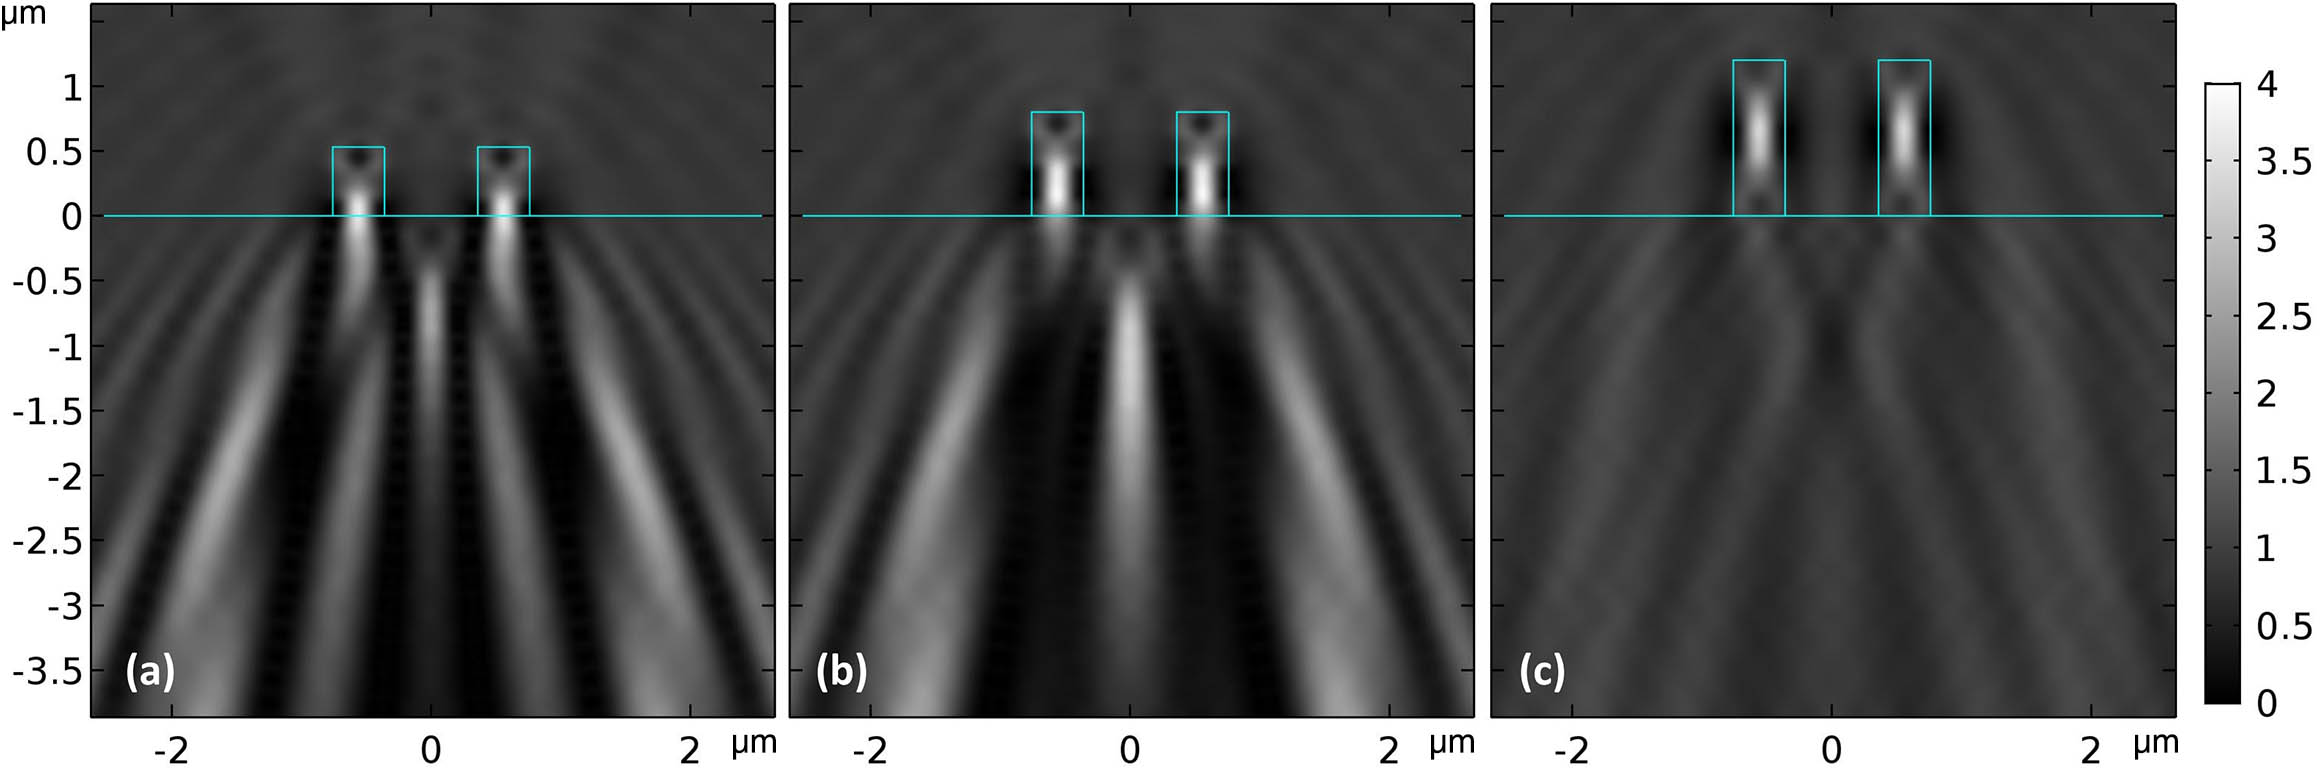
Fig. 1. Diffraction intensity patterns obtained for pairs of dielectric rectangles with different heights
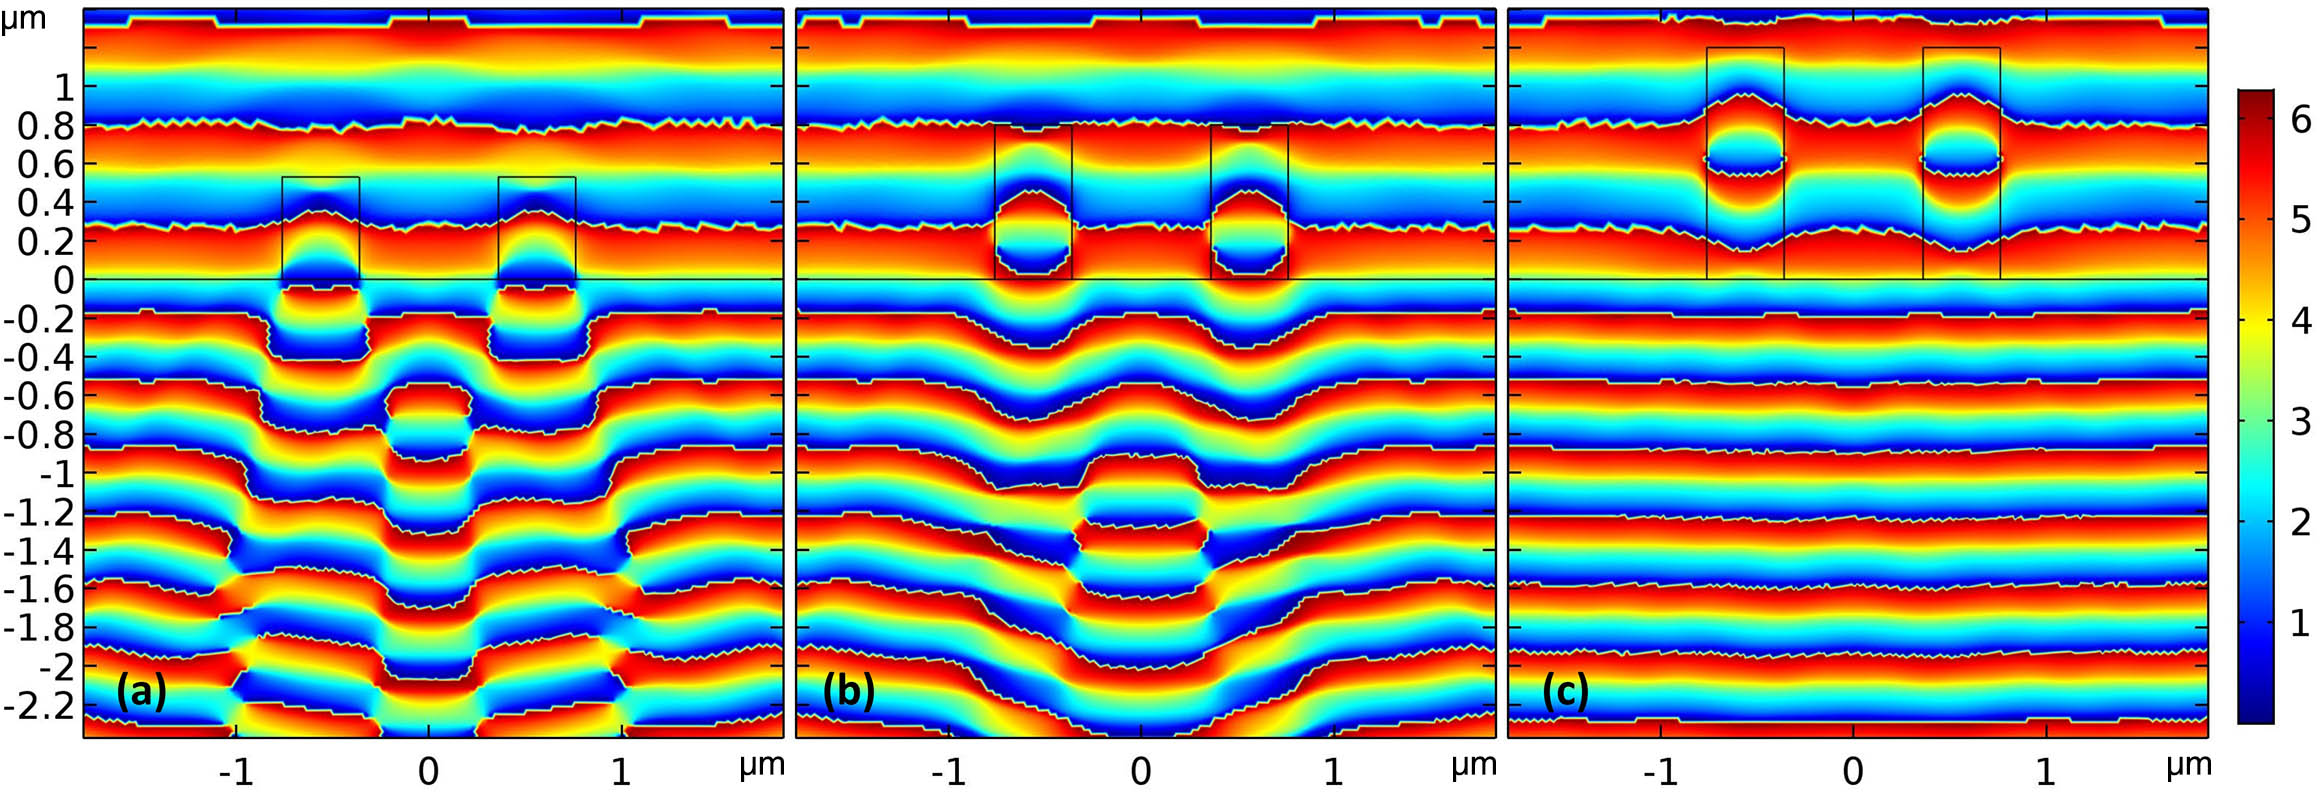
Fig. 2. Phase distribution obtained for pairs of dielectric rectangles with different heights
Fig. 3. Variation of the normalized focusing power (black curve with squares) and the optimized
Fig. 4. Diffraction intensity patterns obtained for pairs of dielectric rectangles with optimized dimensions (
Fig. 5. Schematic of the experimental characterization set-up.
Fig. 6. Experimental 3D intensity distribution below the diffractive polymer microlines.
Fig. 7. First and second rows: intensity distributions along the longitudinal focal axis (
|
Table 1. Calculated Optical Characteristicsa
|
Table 2. Experimental Optical Characteristicsa

Set citation alerts for the article
Please enter your email address
© Copyright 2018-2021 | Chinese Laser Press. All Rights Reserved 沪ICP备15018463号-20